


… and of airflow
Longer life in exchange for more noise? These are also some of the agenda items we’ll cover in our comparison of the Arctic P14 CO fan with the fluid bearing variant. These are actually the main points. In any case, the ball bearings in the more expensive variant of these fans also have specific features that can be easily observed and distinguished even in normal, “home” use.
… and of airflow
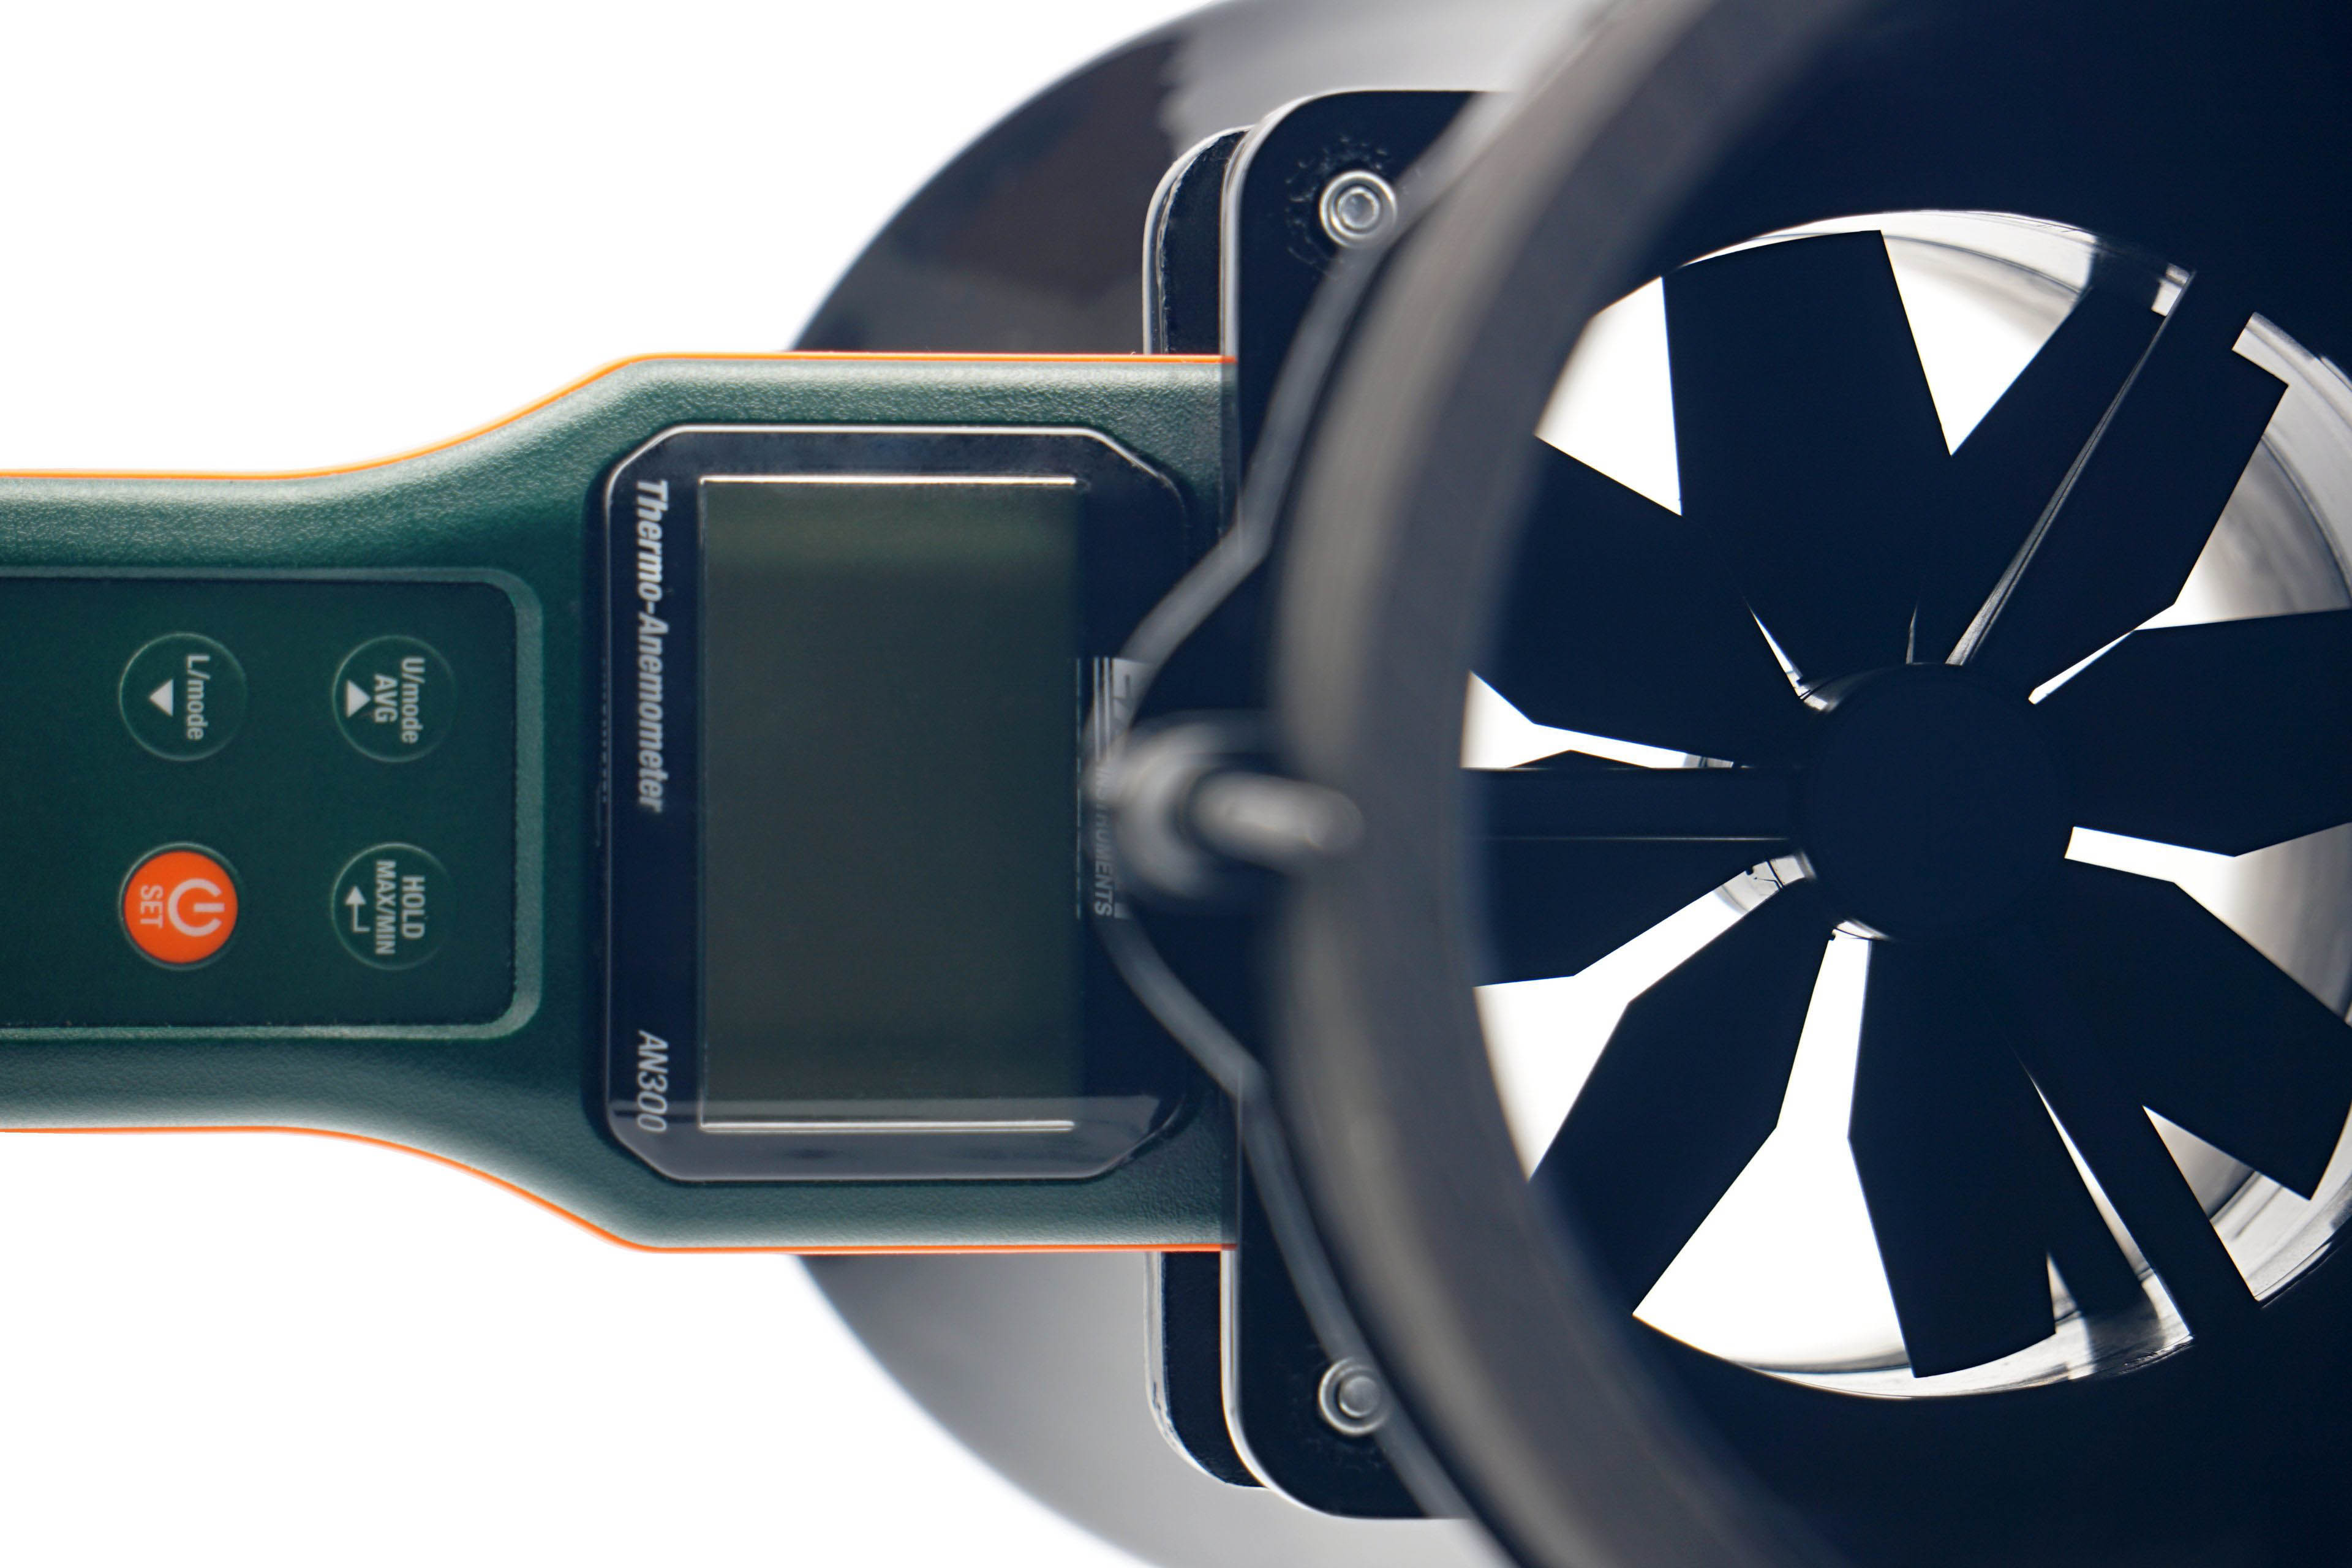
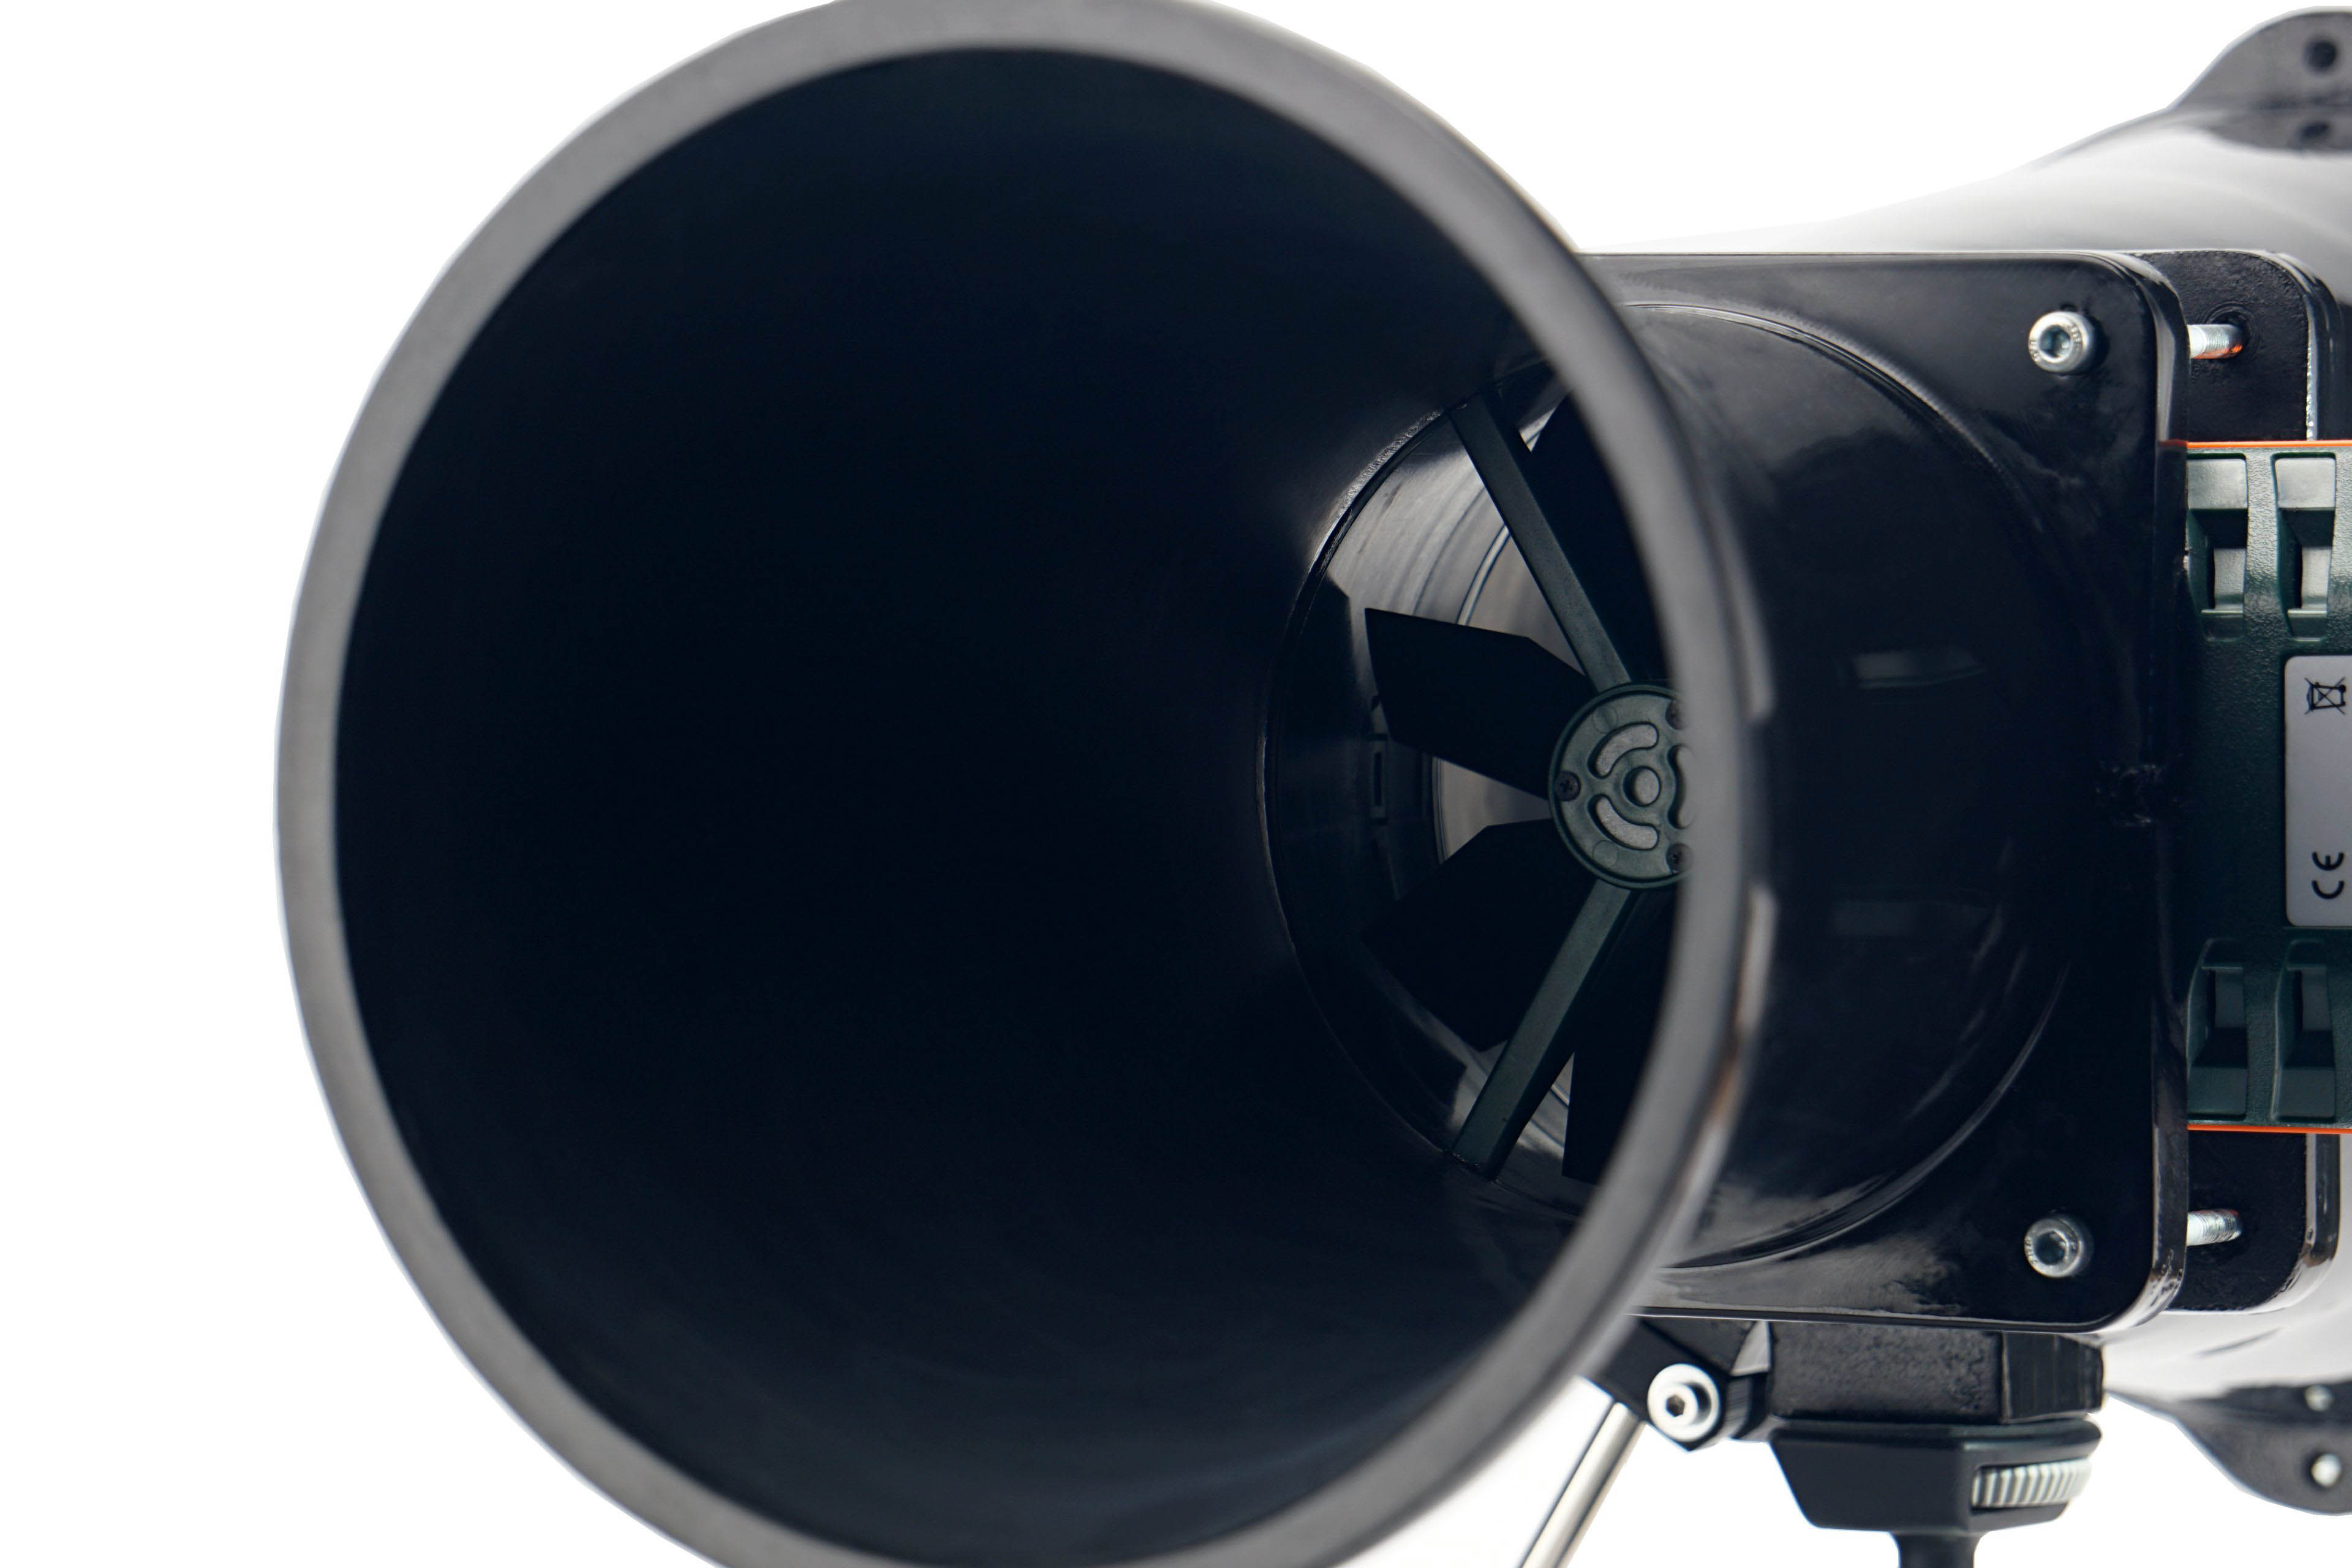
With airflow measurements, we can well explain why the test tunnel is shaped the way it is. It doesn’t consist of two parts just so that the “exhaust” can be conveniently clogged for pressure measurements. The anemometer (i.e. the wind speed measuring instrument) is held together by two parts, two formations, through the flanges.
The front part, at the beginning of which the fan is mounted, becomes steadily narrower and from about two thirds of the way through the cross-section is smaller than that of a 120 mm fan. The reason for this is that the cross-section of the anemometer is always smaller than that of the fans tested. The taper towards the anemometer fan is as smooth as could be chosen and the tunnel walls are smooth. This has minimized the occurrence of unnatural turbulence.
The difference between the cross section at the intake (fan under test) and at the constriction point (anemometer) also means a difference in dynamic pressure, the principles of the Venturi effect apply here. In order to avoid distortion at this level and to ensure that the fan airflow is not different from what it actually is, the Bernoulli equation must be applied to the measured values (for maximum accuracy, the calculation also takes into account the internal cross-sectional area of the anemometer, i.e. its inactive part ). After all this, it is again possible to confront our results with the paper parameters.
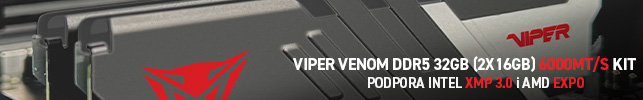
We use an Extech AN300 anemometer with a large 100 mm fan for the measurements. Its big advantage over other anemometers is that it is made for bidirectional sensing. This allows tests at different fan orientations. However, the “pull” position is more suitable or accurate for measurements, even though it may not seem so at first glance, but we’ll explain.
Here, we get to the second part of the tunnel, the part behind the anemometer. It is part of the whole device, mainly to allow a laminar flow of air to arrive at the impeller of the anemometer. Otherwise, uncontrolled side whirls would be reflected in the results, which are inconsistent with accurate measurements. Therefore, we will test the flow in the pull position. If anyone would like us to elaborate more on this topic, we can elaborate further at any time in the discussion below the article. Ask away. 🙂
In regard to the anemometer, we shall return for a bit to noise measurements and to setting modes according to fixed noise levels. It may have occurred to you as you were reading that the anemometer fan is also a source of sound that needs to be filtered out when measuring fans. For this reason, we insert a securing pad between the frame and the anemometer fan before each measurement and mode setting according to the fixed noise level. This, by the way, also holds the anemometer fan during static pressure measurements.
- Contents
- Arctic P14 PWM PST CO in detail
- Overview of manufacturer specifications
- Basis of the methodology, the wind tunnel
- Mounting and vibration measurement
- Initial warm-up and speed recording
- Base 6 equal noise levels…
- ... and sound color (frequency characteristic)
- Measurement of static pressure…
- … and of airflow
- Everything changes with obstacles
- How we measure power draw and motor power
- Measuring the intensity (and power draw) of lighting
- Results: Speed
- Results: Airlow w/o obstacles
- Results: Airflow through a nylon filter
- Results: Airflow through a plastic filter
- Results: Airflow through a hexagonal grille
- Results: Airflow through a thinner radiator
- Results: Airflow through a thicker radiator
- Results: Static pressure w/o obstacles
- Results: Static pressure through a nylon filter
- Results: Static pressure through a plastic filter
- Results: Static pressure through a hexagonal grille
- Results: Static pressure through a thinner radiator
- Results: Static pressure through a thicker radiator
- Results: Static pressure, efficiency depending on orientation
- Reality vs. specifications
- Results: Frequency response of sound w/o obstacles
- Results: Frequency response of sound with a dust filter
- Results: Frequency response of sound with a hexagonal grille
- Results: Frequency response of sound with a radiator
- Results: Vibration, in total (3D vector length)
- Results: Vibration, X-axis
- Results: Vibration, Y-axis
- Results: Vibration, Z-axis
- Results: Power draw (and motor power)
- Results: Cooling performance per watt, airflow
- Results: Cooling performance per watt, static pressure
- Airflow per euro
- Static pressure per euro
- Results: Lighting – LED luminance and power draw
- Results: LED to motor power draw ratio
- Evaluation


Expected results, but still an interesting showcase of the effect of only changing the bearings.
So, the “hum” is still here all the same, despite some claims that the CO version fixes it. ThermalLeft has documented sound differences between revisions too (https://www.youtube.com/watch?v=nt8Ao4GDmzY), but even Arctic themselves doesn’t think revisions will have such an effect. I am starting to think it’s possibly a batch “issue” that may have introduced different properties to the rotor material.
I guess those claims of the CO rumbling less will never come from an official source (from Arctic)? They don’t seem to list among the changes across the revisions the modifications that address this. And personally, I don’t even see the technical reason behind the CO variant or the higher P14 revision (2 vs. 4) being quieter on lower frequencies. The impeller seems to have the same parameters in terms of geometry or material used. Nevertheless, there can certainly be a situation where different noise levels are measured across different fans. But it may not be due to different revisions, and perhaps it may be possible to observe this across different fan pieces of the same revision due to different manufacturing tolerances (which are high in the low-end after all)?
An analysis that tracks the tonal peaks of multiple pieces from the same revisions on each side would shed more light on this. From our experience, we note that the shape of the spectrograms of multiple pieces of the P14 PWM PST rev. 4 compared to P14 PWM PST CO rev. 3 in the low frequency band is identical at the same speed. The small differences in the spectrograms that you see in the tests are mainly just due to the fact that in modes normalized by the same noise levels, the speeds of the two variants (P14 and P14 CO fans) are slightly different. For the CO, the speeds are always set a little lower due to the noisier bearings.
Perhaps what is known as “resonance” is something else that’s not the frequency spike at ~100 Hz. Namely, the sudden increase in noise at specific RPM ranges. Or, perhaps the two issues are lumped together when people talk about it, when in fact the two (sound profile with pronounced low frequency peak, and some RPM ranges being suddenly louder) are different issues (that perhaps are related).
I am sure you would have noticed and mentioned it though, when you’re testing the fans and adjusting the fan speeds again and again.