Initial warm-up and speed recording
What is fascinating about the Arctic P14 is the particularly high contrast of price to (cooling) efficiency. These fans are among the cheapest, while at the same time achieving top results with respect to all 140 mm fans in terms of airflow per unit of noise. And that’s even through obstacles. Arctic has made almost the maximum out of the funds available to produce the fan, and it is definitely worth it.
Initial warm-up…
Before we even start measuring anything, we let the fans run “idle” for a few minutes after plugging them in. This is because immediately after a cold start the fans reach different parameters than after a certain amount of short-term operation.
Until the operating temperature of the lubricant is stabilized, a typically lower maximum performance is achieved. This is because at lower temperatures the lubricant is denser, which is associated with higher friction. Therefore, the fans do not reach maximum speed immediately, but only after the first few seconds. Before the first measurements, we therefore leave the fans running for at least 300 seconds at 12 V, or 100 % PWM intensity.
…and speed recording
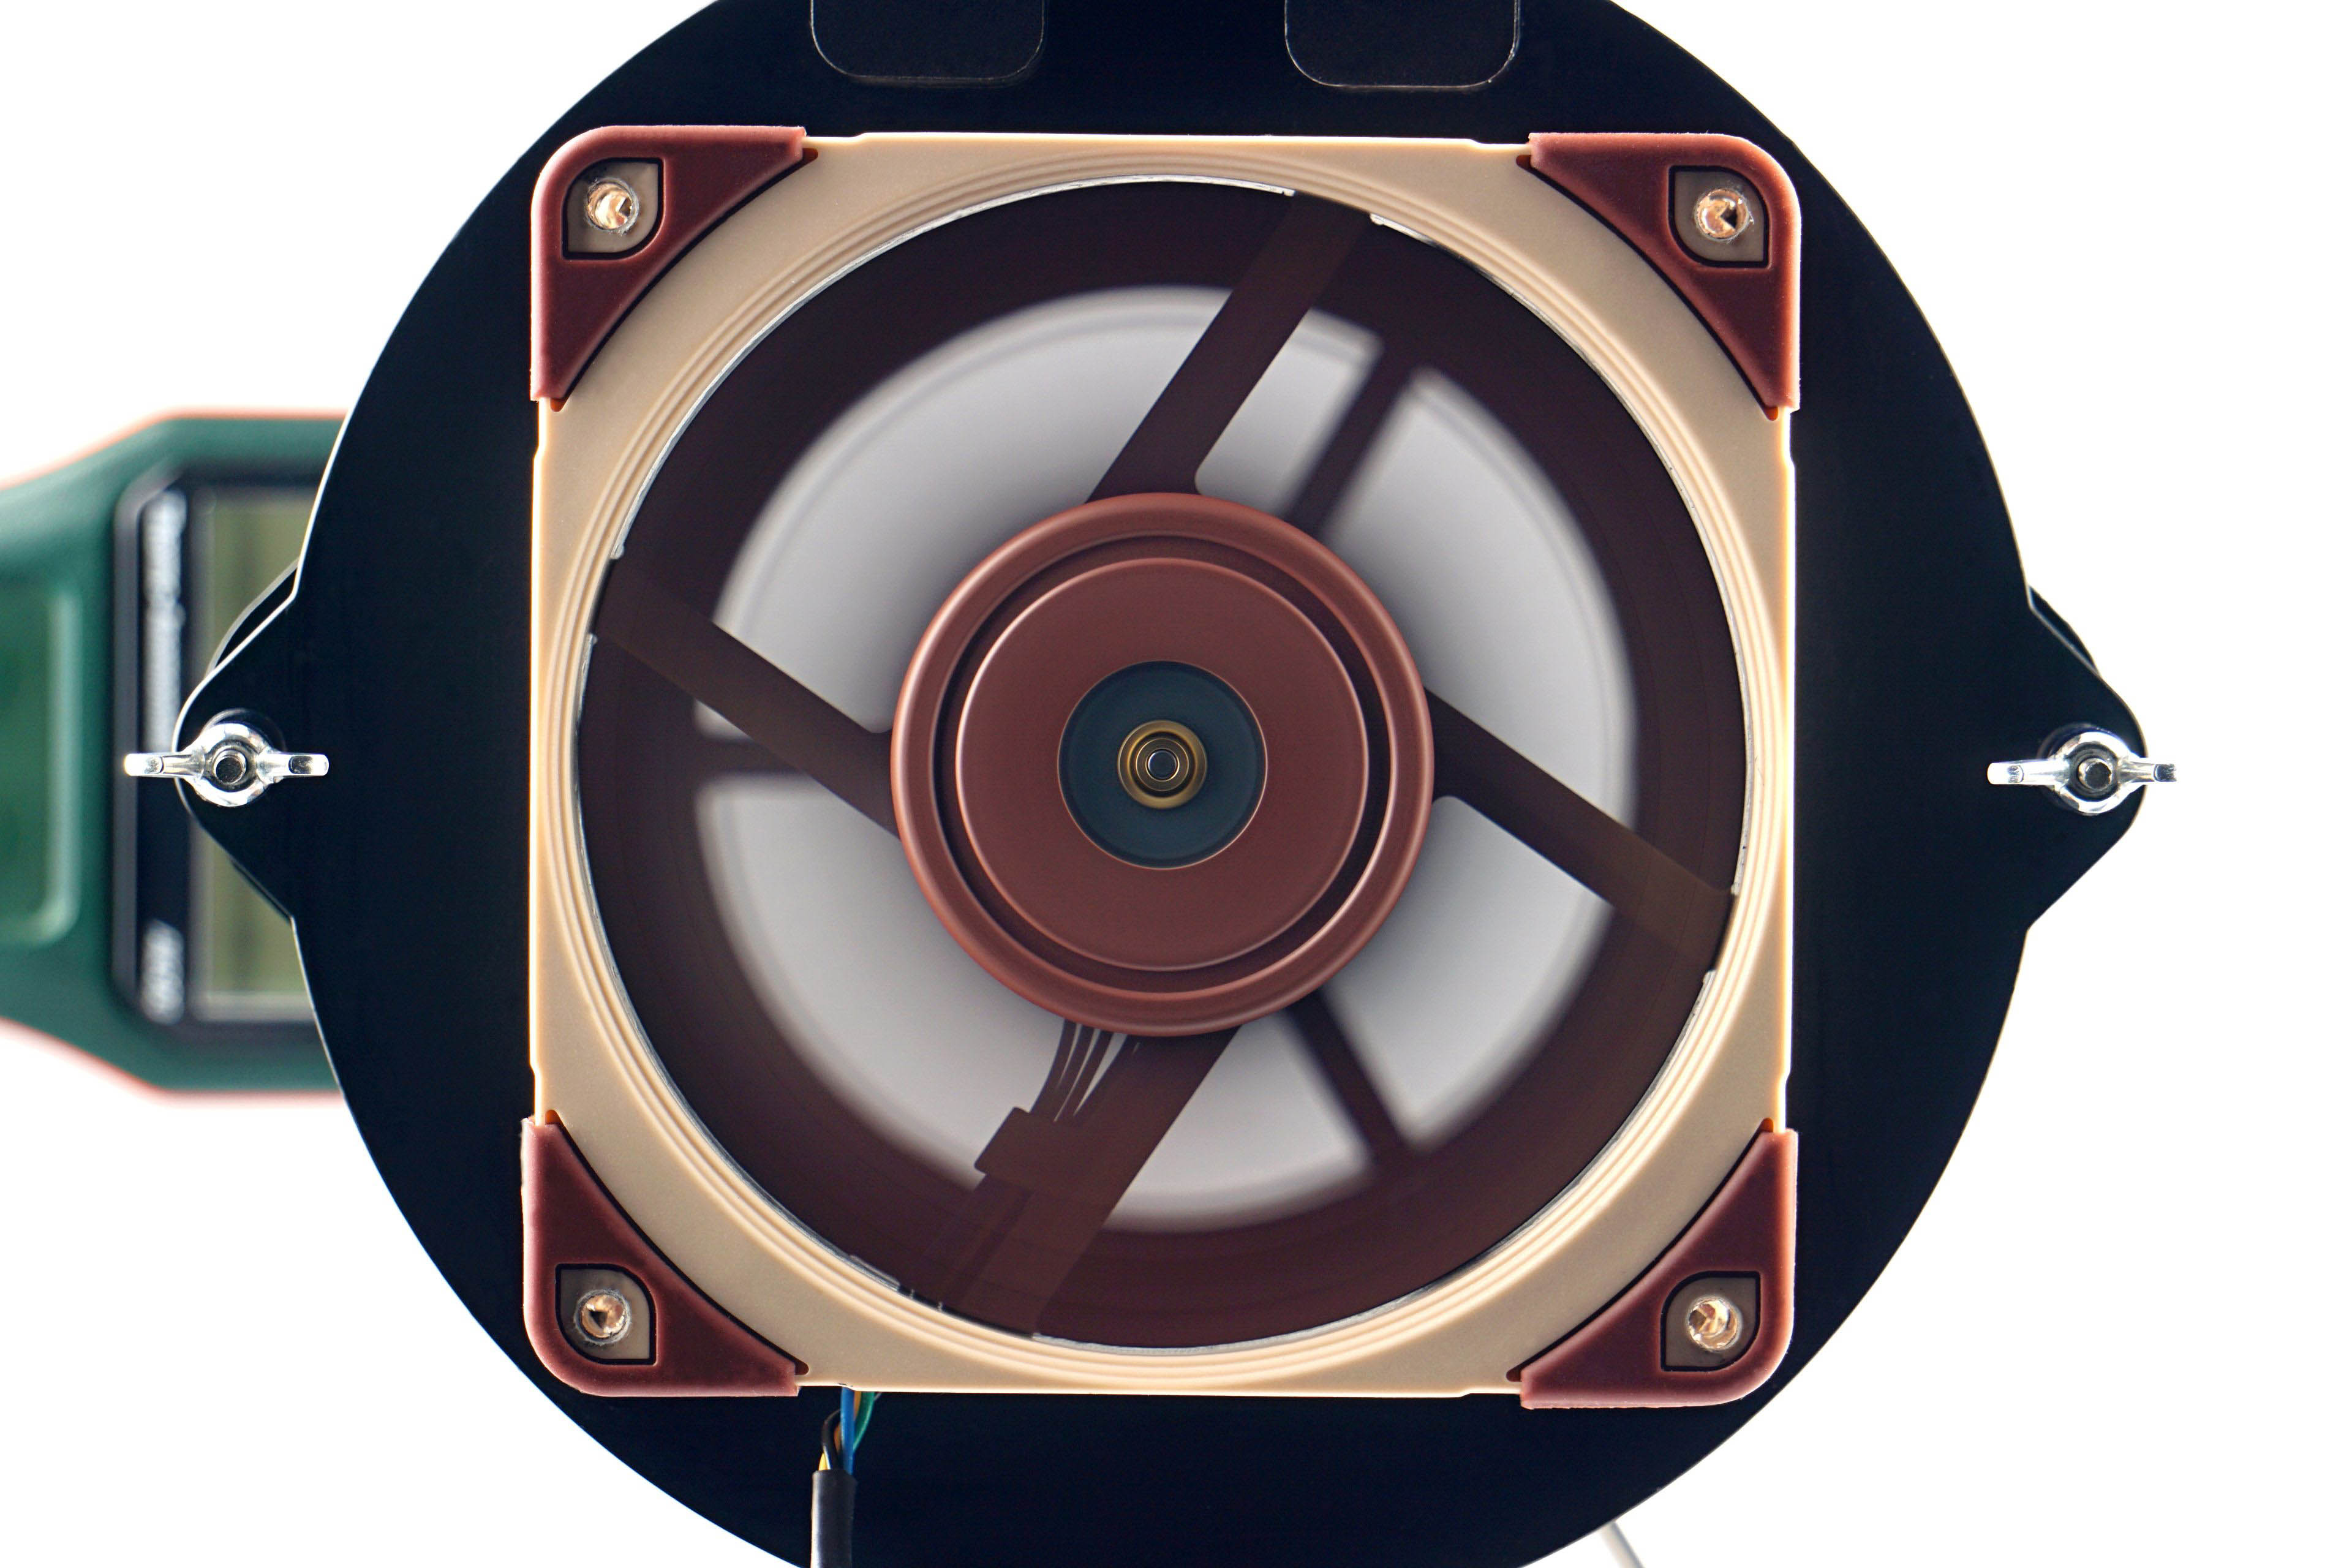
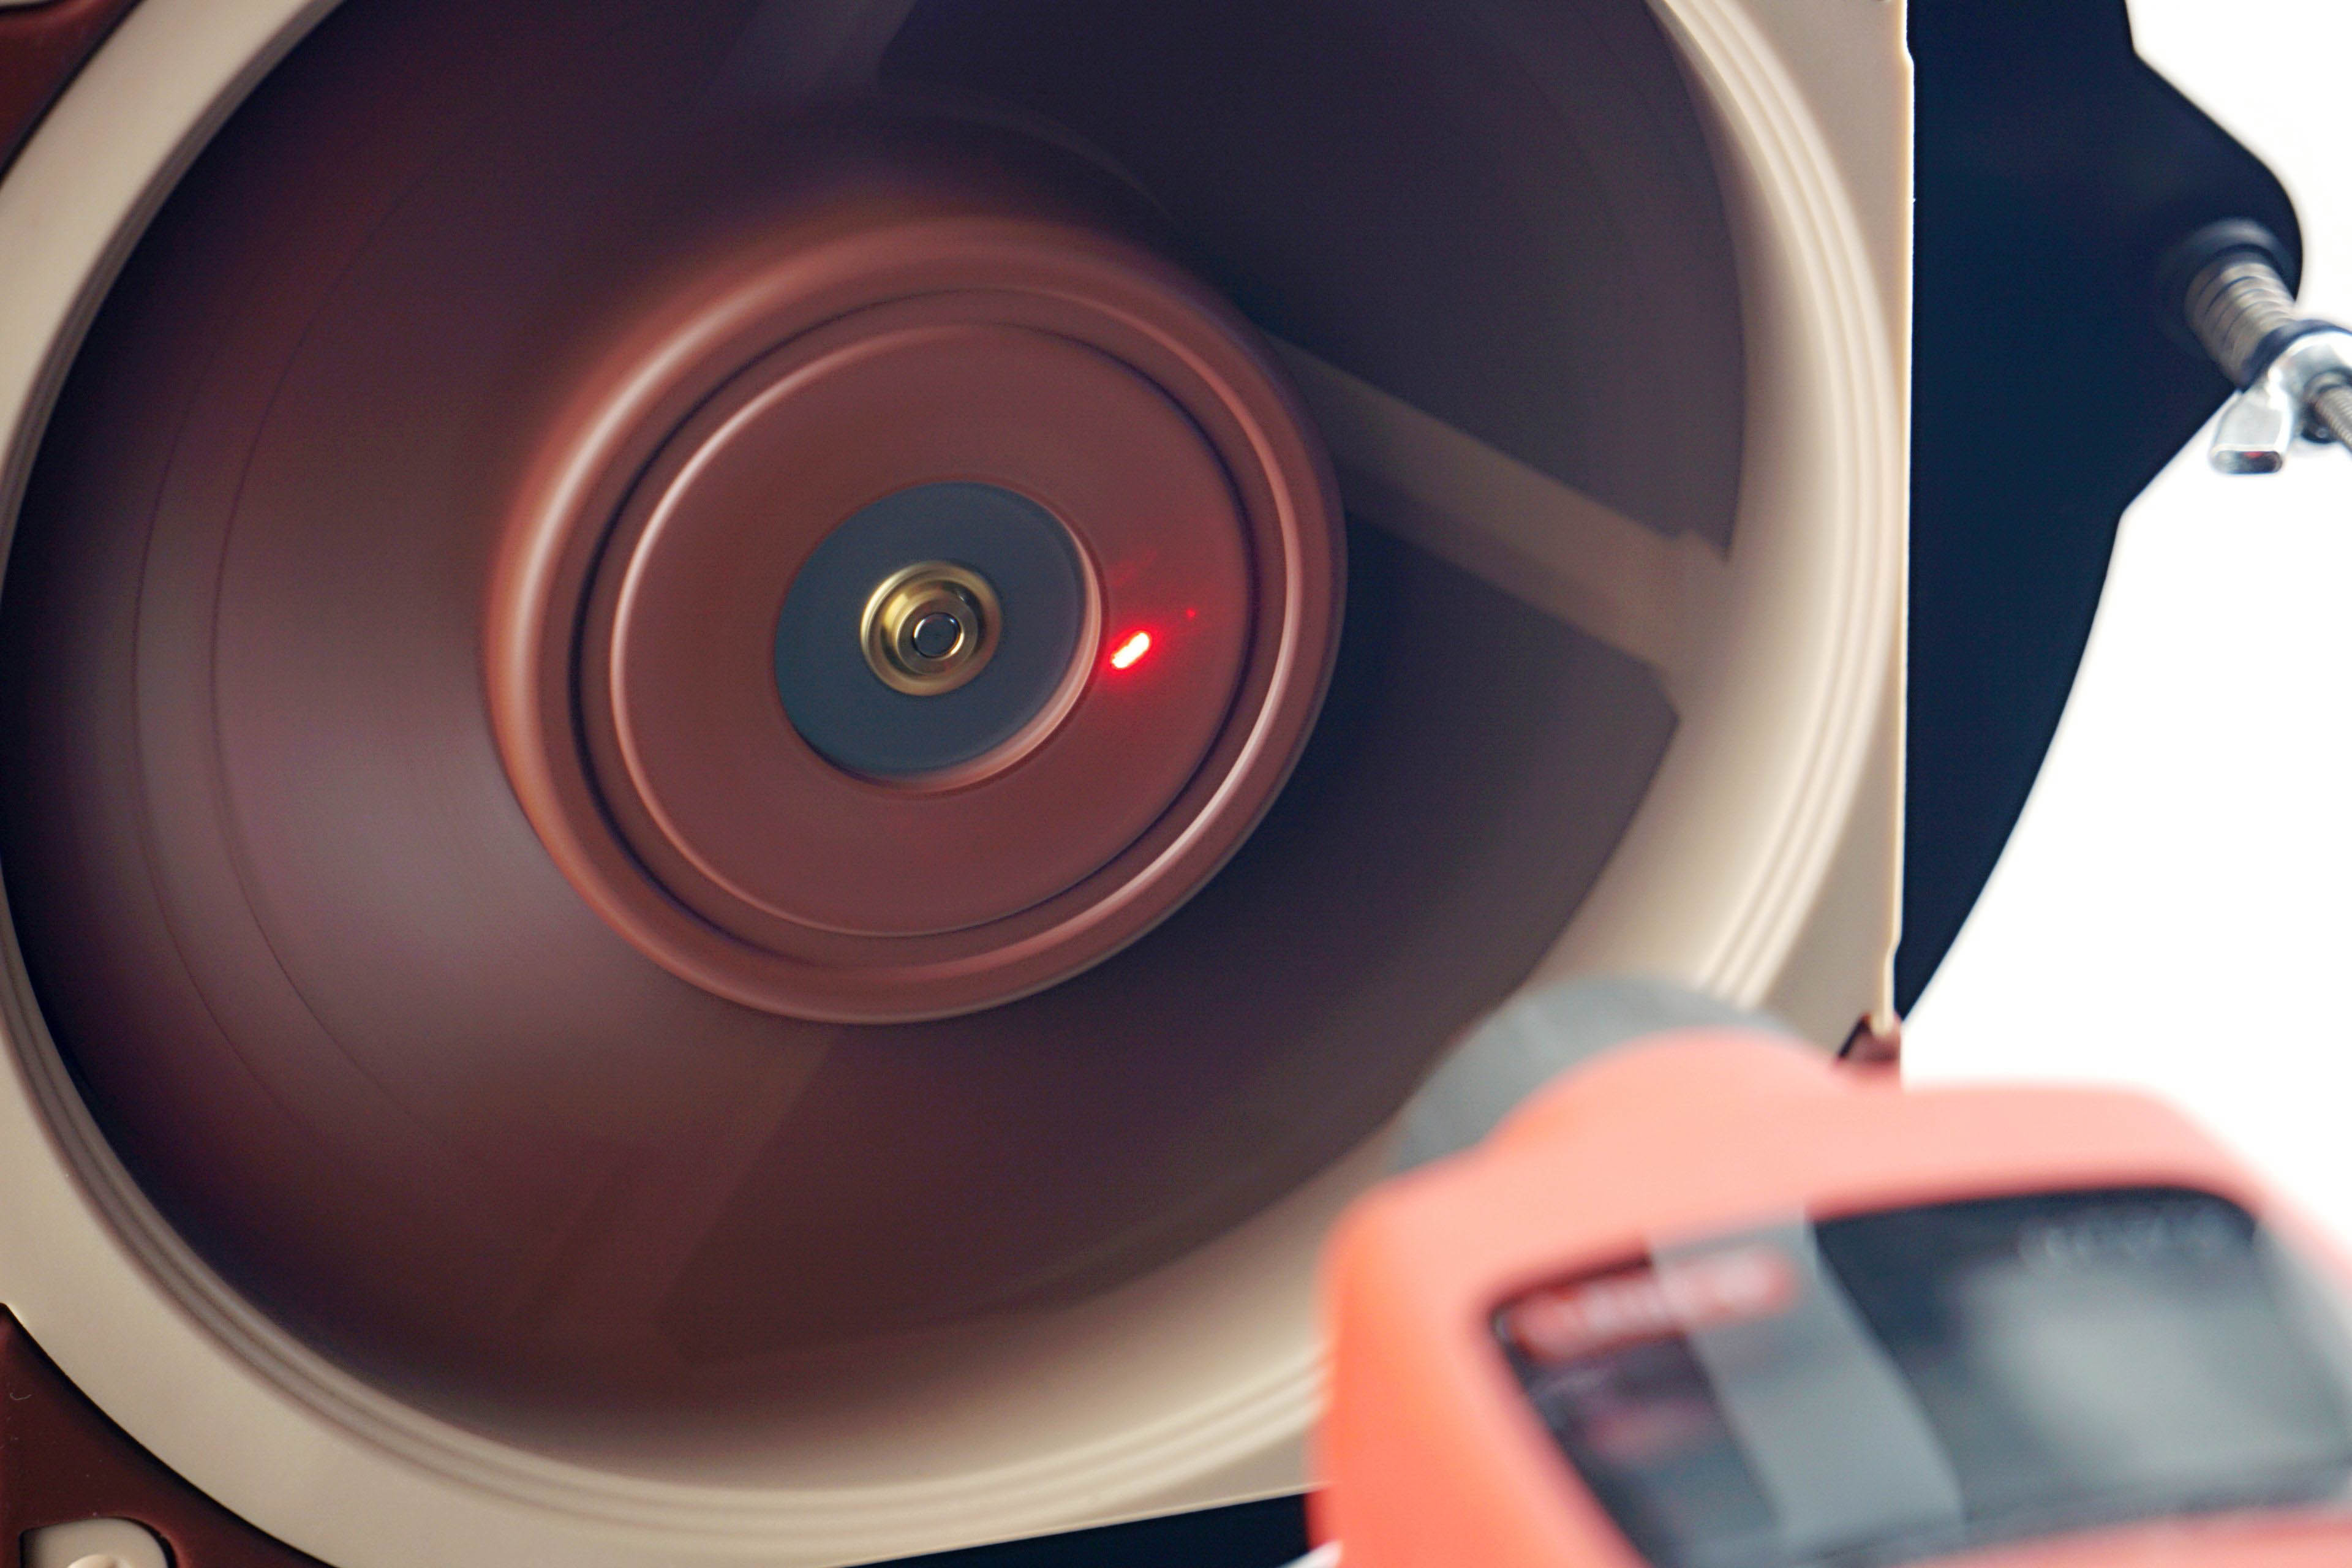
The speed of the fans is monitored using a laser tachometer, which reads the number of revolutions from a reflective sticker on the impeller. For this purpose, we use the UNI-T UT372 device, which also allows real-time averaging of samples. Thus, we do not record the peak value in the graphs, but the average speed value from a 30-second time period.
However, the speed itself is a relatively unimportant parameter that is often given more attention than is appropriate. This is the case even in many fan or cooler tests, where speed is used to normalize the different modes in which other variables are measured.
However, hyper-focusing on a specific speed is a rather unfortunate decision if only because the fans don’t gain any commonality. At the same speed all other variables are different, there is no intersection. It can be noted that a better normalization would have been by any other variable, whether it be static pressure, flow or noise level, which wins in our case. But more on that in the next chapter.
We only measure the speed so that you can associate a particular parameter (such as the amount of static pressure or some noise level) with something according to which you can adjust the fan yourself. Perhaps for that alone, the information about the achieved speed is useful. As part of the fan analysis, we will also indicate what the fans’ starting and minimum speeds are. Start-up speeds tend to be higher than minimum speeds because more force is required to get the impeller moving than once the fan impeller is spinning, and a minimum power intensity is sought at which the fan does not stall.
- Contents
- Arctic P14 PWM PST in detail
- Overview of manufacturer specifications
- Basis of the methodology, the wind tunnel
- Mounting and vibration measurement
- Initial warm-up and speed recording
- Base 6 equal noise levels…
- ... and sound color (frequency characteristic)
- Measurement of static pressure…
- … and of airflow
- Everything changes with obstacles
- How we measure power draw and motor power
- Measuring the intensity (and power draw) of lighting
- Results: Speed
- Results: Airlow w/o obstacles
- Results: Airflow through a nylon filter
- Results: Airflow through a plastic filter
- Results: Airflow through a hexagonal grille
- Results: Airflow through a thinner radiator
- Results: Airflow through a thicker radiator
- Results: Static pressure w/o obstacles
- Results: Static pressure through a nylon filter
- Results: Static pressure through a plastic filter
- Results: Static pressure through a hexagonal grille
- Results: Static pressure through a thinner radiator
- Results: Static pressure through a thicker radiator
- Results: Static pressure, efficiency depending on orientation
- Reality vs. specifications
- Results: Frequency response of sound w/o obstacles
- Results: Frequency response of sound with a dust filter
- Results: Frequency response of sound with a hexagonal grille
- Results: Frequency response of sound with a radiator
- Results: Vibration, in total (3D vector length)
- Results: Vibration, X-axis
- Results: Vibration, Y-axis
- Results: Vibration, Z-axis
- Results: Power draw (and motor power)
- Results: Cooling performance per watt, airflow
- Results: Cooling performance per watt, static pressure
- Airflow per euro
- Static pressure per euro
- Results: Lighting – LED luminance and power draw
- Results: LED to motor power draw ratio
- Evaluation