It didn't work out for the first time, but…
The announced update to increase performance in MFS is out, and we have a “before” and “after” comparison for you. Developers has worked to ensure that the processor does not significantly bottleneck the GPU. So far, the performance of the graphics card did not matter much, because only a fraction of its potential was used. But newly, you will achieve better performance on low-end hardware than you did before on a top-end rig.
Historically, all Microsoft flight simulators have been characterized by very high hardware requirements. But to what extent inefficient programmers are involved, and to what extent the low performance in MFS used to be justified by the complexity of the game is a question. The update from July shows that the engine rewrite significantly increased the in-game performance, while visually there were virtually no changes. So far, the game still runs on DirectX 11, although the Asobo studio has long announced that it is planning to switch to Dx12 in the near future. This will probably happen later.
The big update (40.3 GB) was released on July 27, but it’s not quite “done” yet, the developers are collecting feedback, and things that used to work are constantly being repaired within small patches. However, it is natural and you can follow what is currently happening with MFS in this list of known issues. It is constantly expanding, and if you come across something special, let them know. However, these are more or less small details and the performance should not change fundamentally.

We are relatively well prepared for performance tests, as we have been intensively testing processors and graphics cards in this game for half a year. From the results measured in tests of graphics cards so far, it is clear that the processor is a bottleneck. And a very significant one, as the MFS on the GeForce RTX 3090 ran in FHD and QHD (with graphics settings to Ultra) as slow as on the RTX 3060. The average difference in gaming performance between these cards is 50–60%. In Flight Simulator, even in FHD (1080p) and QHD (1440p) resolutions, it is only 1 to 3%. In UHD (2160p) the difference is already quite significant, but on average barely 36 fps with drops to 29 fps is still a weak result for the GeForce RTX 3090. And the smoothness in some locations will certainly be lower than in our test scene (Paris-Charles de Gaulle, Air Traffic: AI, February 14, 9:00).

We tested the performance of the updated game with the processors we currently have at hand in our testlab. These include the Ryzen 9 5900X, which is a stable processor from a test setup for graphics cards, but also the Core i5-10400F, and the Ryzen 7 3700X. We use the MSI RTX 3080 Gaming X Trio graphics card with these processors, and it is actually a standard setup of test methodology for processors. This includes the graphical settings in the game, which you will find in the notes and on the screenshots of the chapters with the test results.
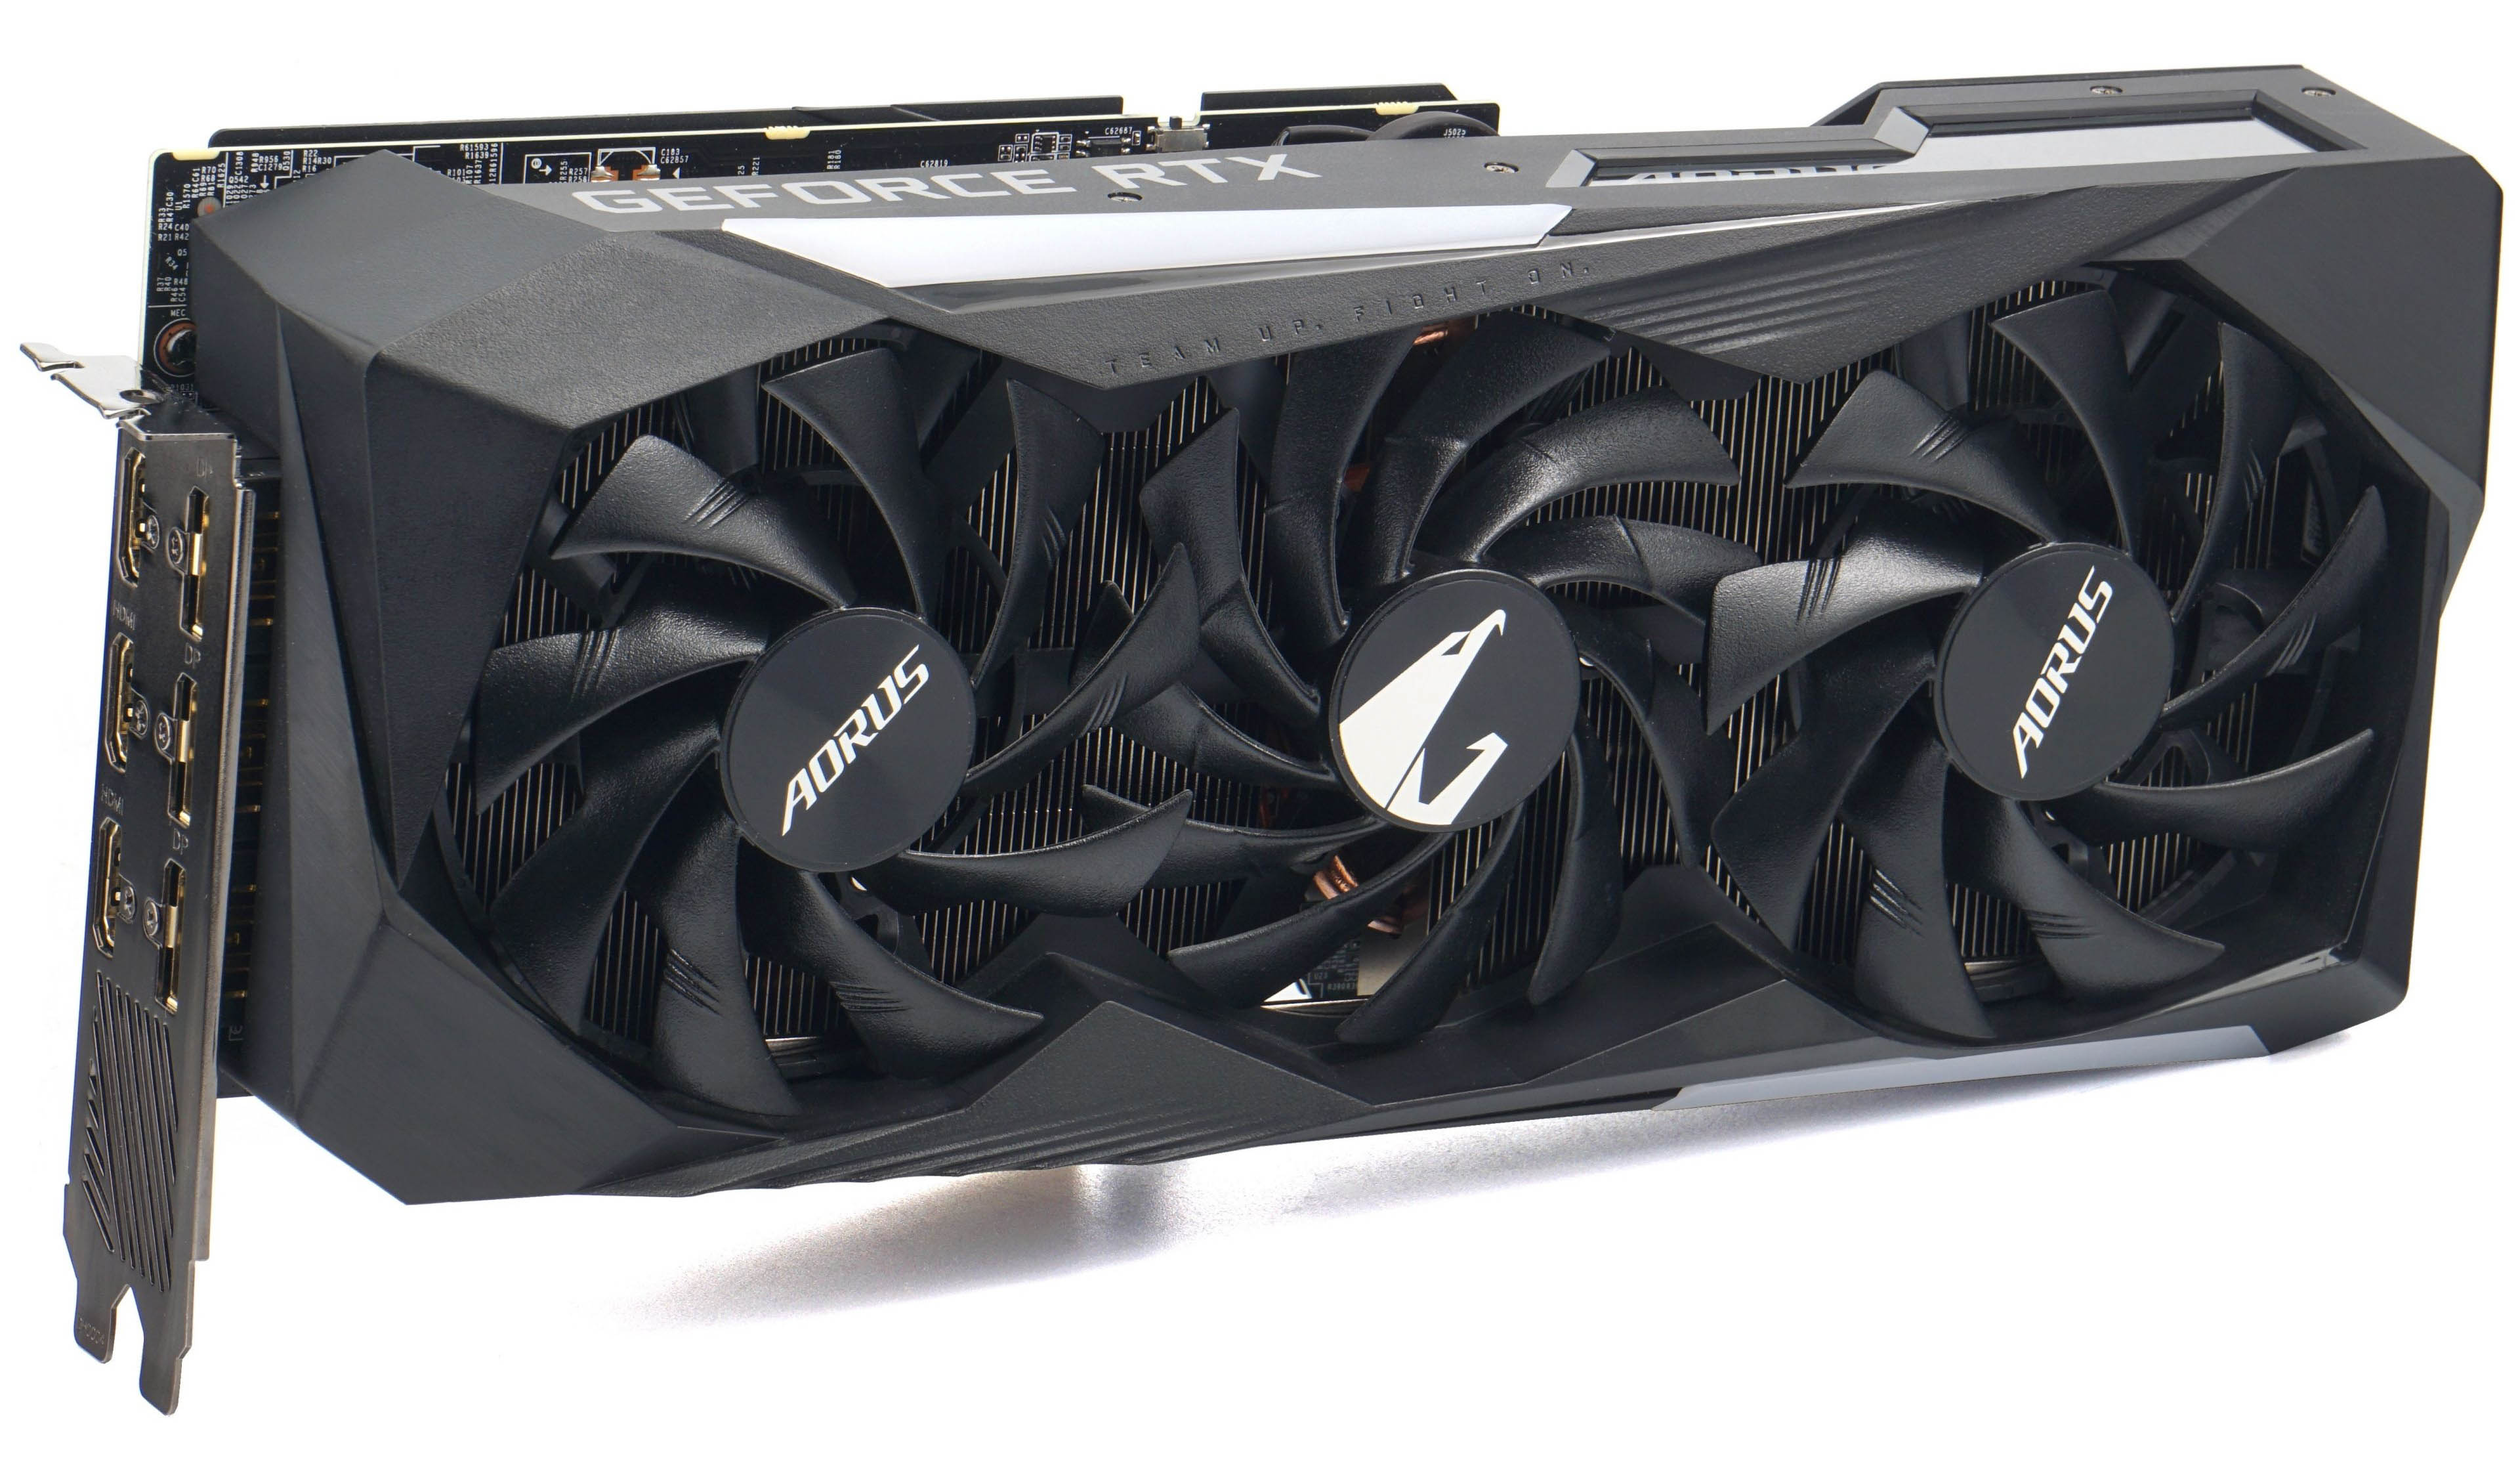
To illustrate how the performance of the GPU has changed, we also proceed in the standard way, i.e. using the methodologies for testing graphics cards. As part of these tests, we also added bar graphs that monitor the trends of the times of individual frames, but also, for example, a comparison of variability (stability) of fps or microstuttering (i.e. small tearing at the level of consecutive frames that the gross fps values do not capture). So far, that has also made the game unpleasant. For this purpose, we used the Gigabyte Aorus RTX 3070 Master 8G with the performance BIOS, i.e. the OC profile.
Outdated results are distinguished from the current ones in the graphs by the final designation “SU4” (Sim Update 4) or “SU5” (Sim Update 4) and are also distinguished by color. SU4 always has a gray stripe or if it is colored, it has a weaker shade than the stripe with the SU5 result.
- Contents
- It didn't work out for the first time, but…
- Test setup
- Results, CPU tests
- Results, GPU tests
- … no more limits