Table of parameters
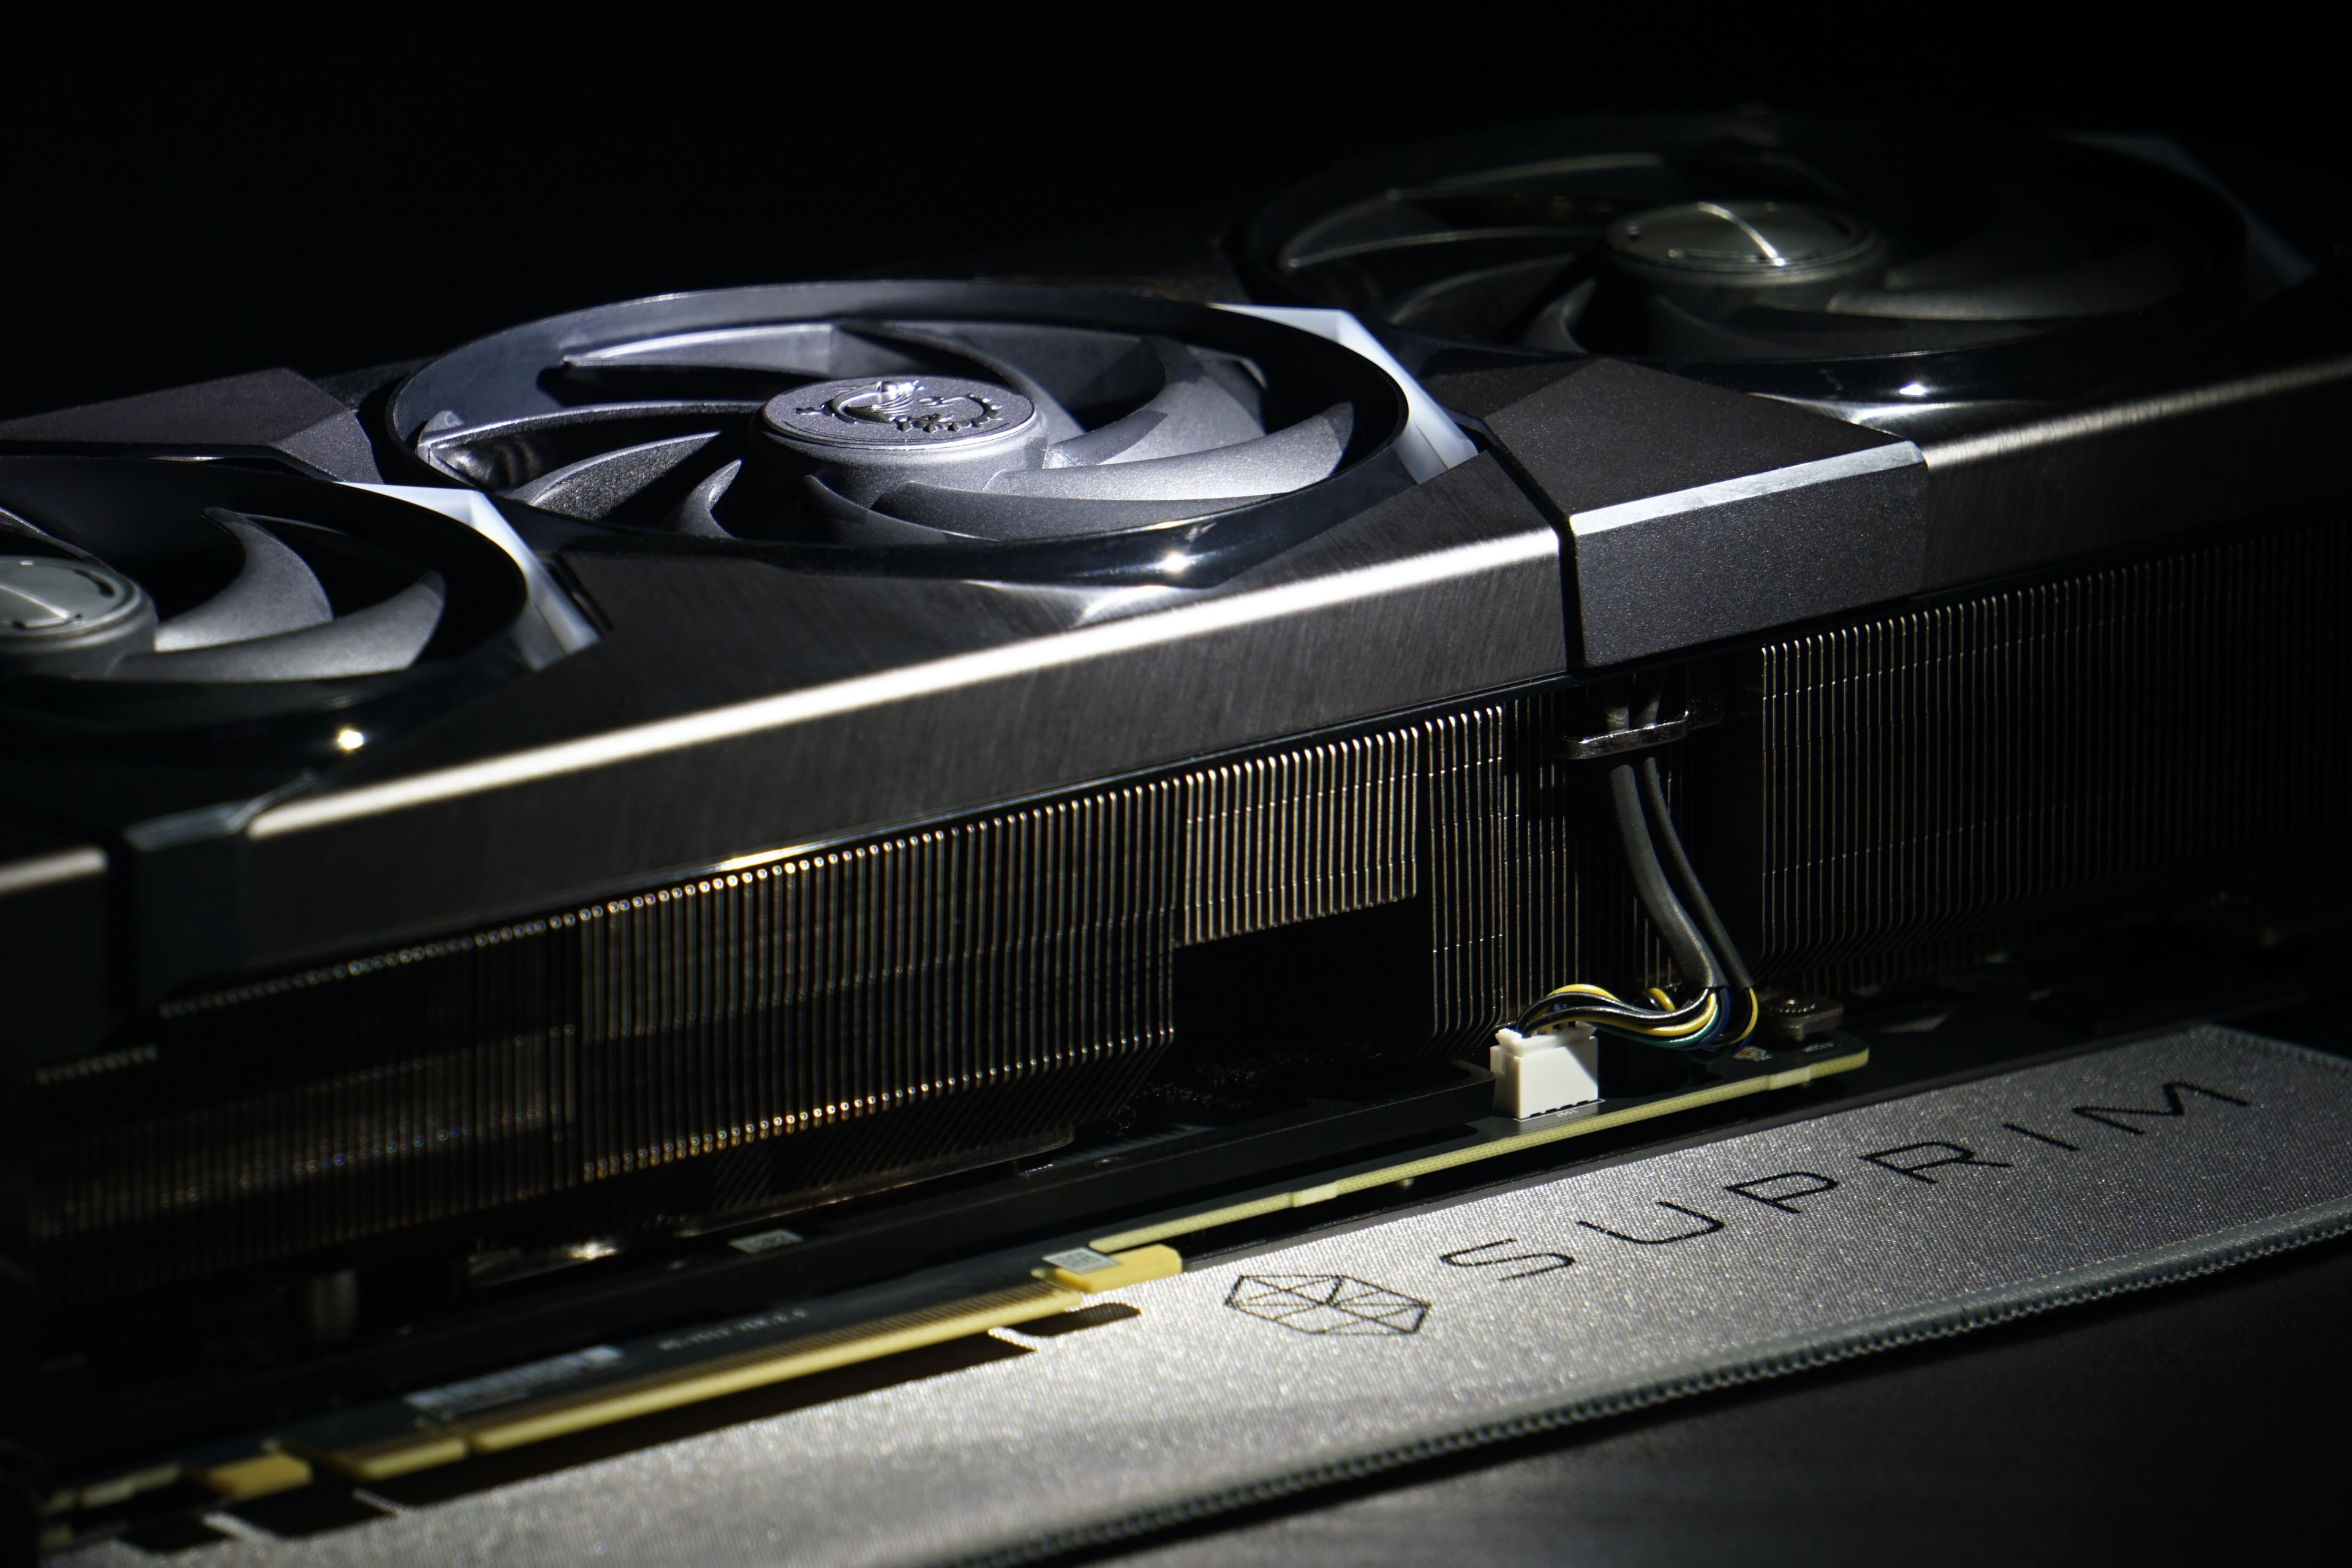
After the GeForce RTX 4080 graphics cards, which wasn’t to many people’s taste due to the higher price, Nvidia has released a significantly cheaper GPU for the GeForce RTX 4070 Ti. The performance versus the RTX 4080 is admittedly noticeably weaker, but percentage-wise not by as much as the roughly two-thirds lower price of the RTX 4070 Ti. In our tests, we analyze MSI’s non-reference design from the top-of-the-line Suprim X series.
| Parameters | MSI RTX 4070 Ti Suprim X 12G | |
| MSI RTX 4070 Ti Suprim X 12G | ||
| Architecture | Ada Lovelace | |
| Die | AD104-400-A1 | |
| Manufacturing node | 4 nm TSMC | |
| Die size | 295 mm² | |
| Transistor count | 35,8 bn. | |
| Compute units | 60 | |
| Shaders/CUDA cores | 7680 | |
| Base Clock | 2310 MHz | |
| Game Clock (AMD) | – | |
| Boost Clock | 2775 MHz | |
| RT units | 60 | |
| AI/tensor cores | 240 | |
| ROPs | 80 | |
| TMUs | 240 | |
| L2 Cache | 48 MB | |
| Infinity Cache | – | |
| Interface | PCIe 4.0 ×16 | |
| Multi-GPU interconnect | – | |
| Memory | 12 GB GDDR6X | |
| Memory clock (effective) | 21.0 GHz | |
| Memory bus | 192 bit | |
| Memory bandwidth | 504.2 GB/s | |
| Pixel fillrate | 222.0 Gpx/s | |
| Texture fillrate | 666.0 Gtx/s | |
| FLOPS (FP32) | 42.62 TFLOPS | |
| FLOPS (FP64) | 666.0 GFLOPS | |
| FLOPS (FP16) | 42.62 TFLOPS | |
| AI/tensor TOPS (INT8) | 170.5 | |
| AI/tensor FLOPS (FP16) | 341.0 | |
| TDP | 285 W | |
| Power connectors | 1× 16-pin | |
| Card lenght | 338 mm | |
| Card slots used | 73 mm | |
| Shader Model | 6.6 | |
| DirectX/Feature Level | DX 12 Ultimate (12_2) | |
| OpenGL | 4.6 | |
| Vulkan | 1.3 | |
| OpenCL | 3.0 | |
| CUDA | 8.9 | |
| Video encoder engine | NVEnc 8 | |
| Encoding formats | HEVC, H.264, AV1 | |
| Encoding resolution | 8K | |
| Video decoder engine | NVDec 5 | |
| Decoding formats | HEVC, H.264,VP9, AV1 | |
| Decoding resolution | 8K | |
| Max. Monitor resolution | 7680 × 4320 px | |
| HDMI | 1× (2.1) | |
| DisplayPort | 3× (1.4a) | |
| USB-C | – | |
| MSRP | 1055 EUR |
Continue: Methodology: performance tests
- Contents
- MSI RTX 4070 Ti Suprim X 12G in detail
- Table of parameters
- Methodology: performance tests
- Methodology: how we measure power draw
- Methodology: noise and sound measurement
- Methodology: temperature tests
- Test setup
- 3DMark
- Age of Empires II: DE
- Assassin’s Creed: Valhalla
- Battlefield V
- Battlefield V with DXR
- Borderlands 3
- Control
- Control with DXR and DLSS
- Counter-Strike: GO
- Cyberpunk 2077
- Cyberpunk 2077 with DLSS
- Cyberpunk 2077 with DXR (and DXR with DLSS)
- DOOM Eternal
- F1 2020
- FIFA 21
- Forza Horizon 4
- Mafia: DE
- Metro Exodus
- Metro Exodus with DXR and DLSS
- Microsoft Flight Simulator
- Red Dead Redemption 2 (Vulkan)
- Red Dead Redemption 2 (Dx12)
- Shadow of the Tomb Raider
- Shadow of the Tomb Raider with DXR
- Total War Saga: Troy
- Wasteland 3
- Overall gaming performance and performance per euro
- CompuBench (OpenCL)
- SPECviewperf 2020 and SPECworkstation 3
- FLOPS, IOPS and memory speed tests
- 3D rendering 1/2 (LuxMark a Blender@Cycles)
- 3D rendering 2/2 (Blender@Radeon ProRender and Eevee)
- Photo editing (Adobe Photoshop, Lightroom and Affinity Photo)
- Broadcasting (OBS and Xsplit)
- Password cracking
- GPU clock speeds
- GPU and VRAM temperatures
- Net GPU power draw and performance per watt
- Analysis of 12 V branch power supply (higher load)
- Analysis of 12 V branch power supply (lower load)
- Analysis of 3,3 V branch power supply
- Noise level
- Frequency response of sound
- Conclusion