


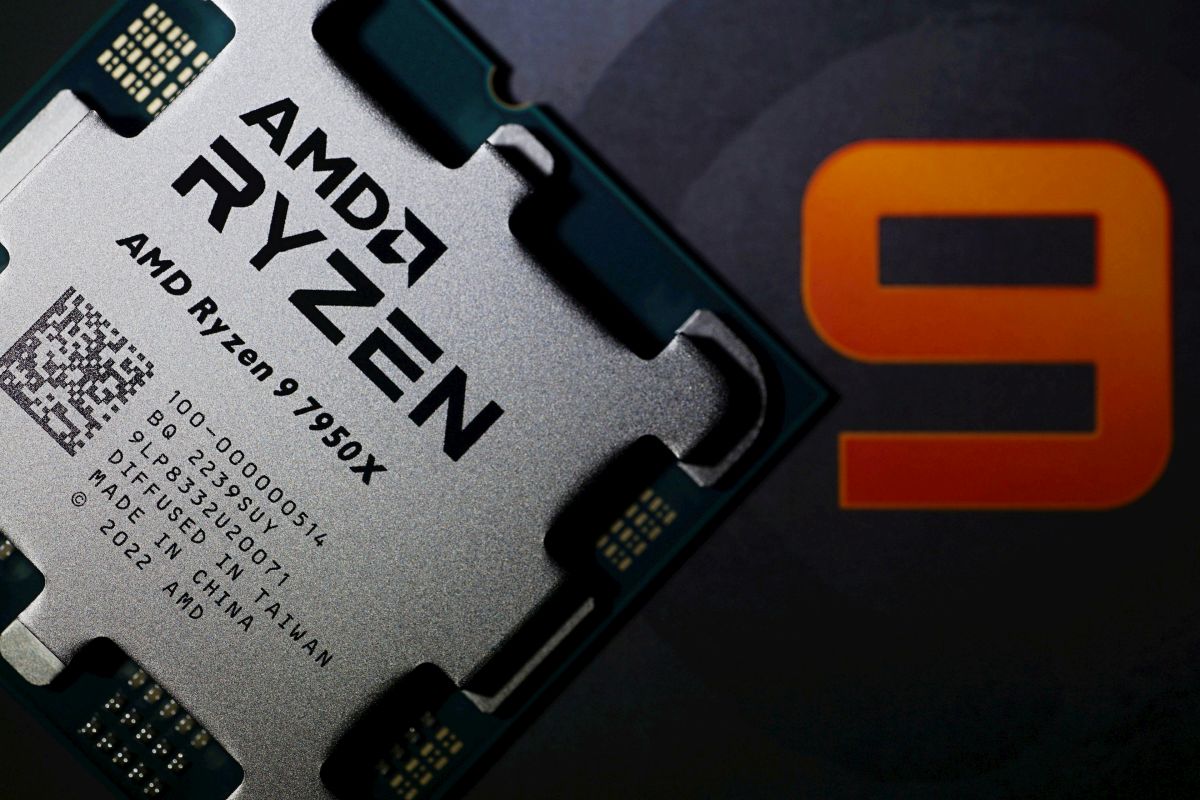
AMD Ryzen 9 7950X in detail
We saved our tests of the most powerful Ryzen 7000 processor for last, for a number of reasons, as the last “X” model to expand the results database from this generation. The Ryzen 9 7950X, with its 32 threads, stands up to its 32-threaded competitor in the form of the Core i9-13900K with sovereignty, despite having eight fewer cores. Some might even state that it is the more cost-effective processor. But it comes down to your own point of view.
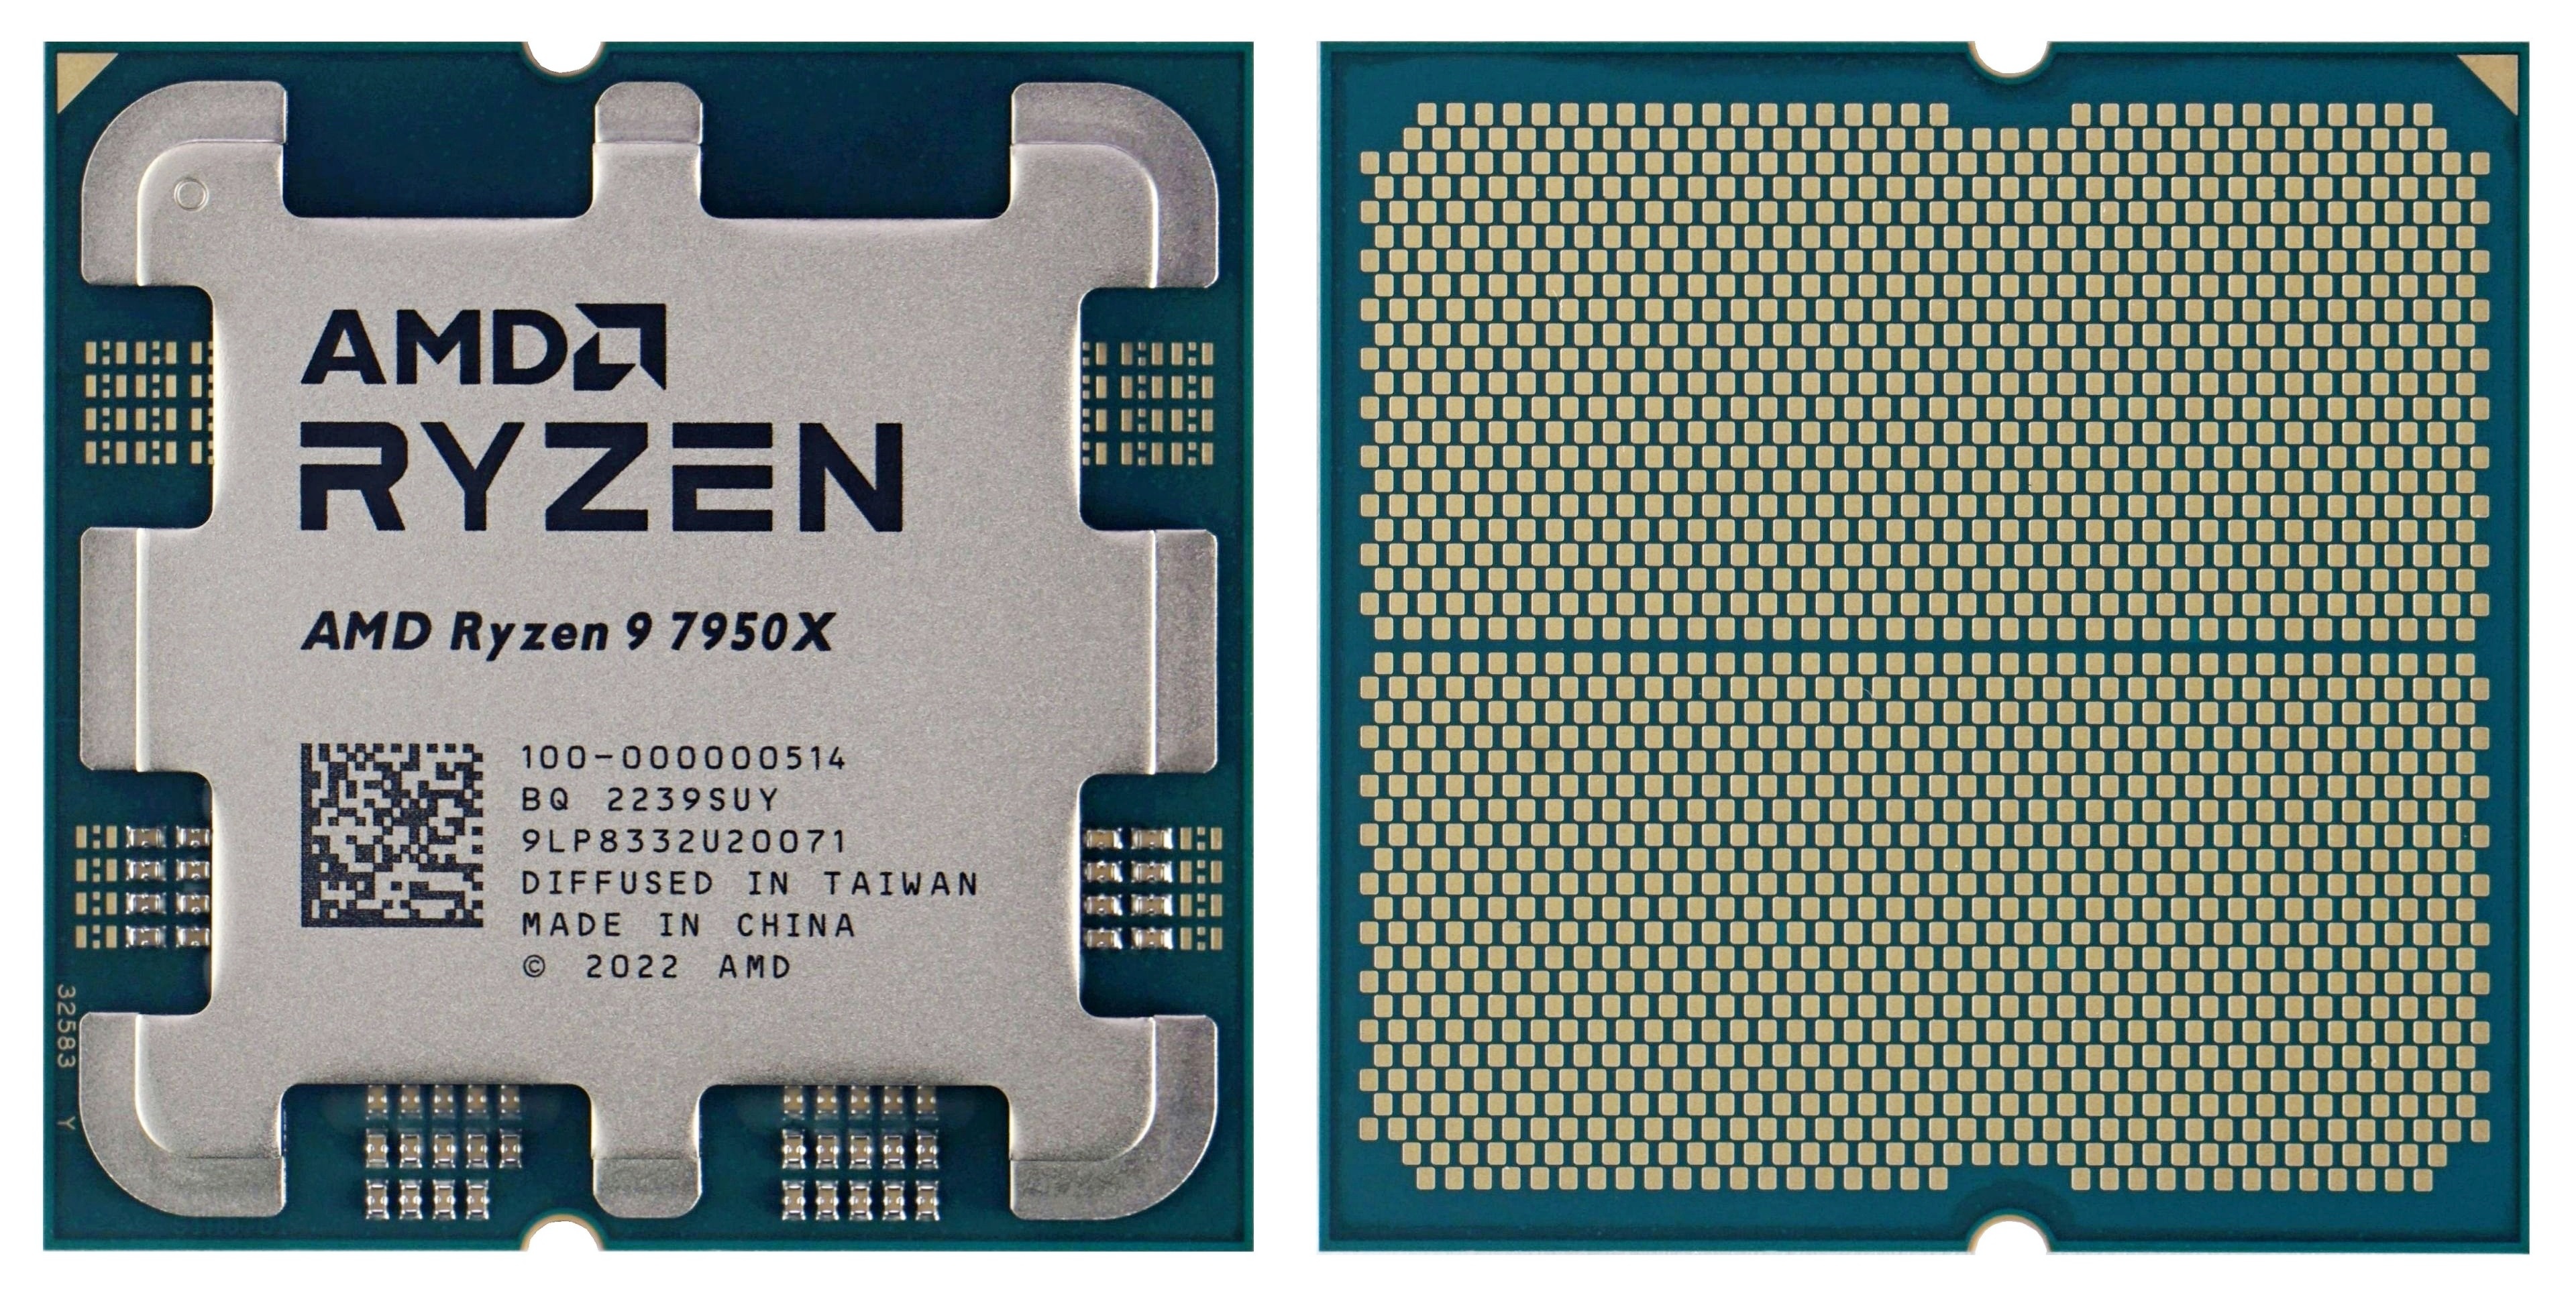
AMD Ryzen 9 7950X in detail
The more powerful of the pair of Ryzen 9 “Raphael” processors (7950X) has the benefit (compared to the 7900X) of four cores operating in eight threads. This alone suggests that this processor will achieve higher multi-threaded performance, but due to the same PPT limit (230 W), there will be a lower all-core boost clock speed per core. AMD doesn’t specify its amount in the parameters, but for the base clock speed it already writes minus 200 MHz, by which the R9 7950X is slower.
However, in single-core boost, this processor should be 100 MHz faster (than R9 7900X) with optimal cooling. Thus, single-core performance may eventually be higher. Eventually because, like the R9 7900X, the R9 7950X makes it extremely difficult to keep the cores, which “in turns” contribute to single-threaded performance, below 70°C. As the temperature rises, the achieved clock speed gradually decreases. And more aggressively than the competing Intel Core i9-13900K processor with the same cooler. We’ll get to that in more detail when we analyze the results.
For now, for a basic overview, we’ll note that the retail prices of these processors (Ci9-13900K and R9 7950X) are almost overlapping at the moment – AMD’s Ryzen is a few euros more expensive somewhere, Intel’s Core i9 is elsewhere, and motherboards with comparable features are selling for similar money. In the case of Core i9, as with all Intel Raptor Lake processors, it is possible to save with a platform with DDR4 memory. Ryzen 7000 processors do not have a “dual” controller and only the newer (and more expensive) DDR5 memory standard can be used.

A cooler doesn’t come with either processor, and both have an integrated graphics core. In the case of the Core i9, there is also the a few euros cheaper “KF” variant with a non-functional/deactivated iGPU. The 16-core Ryzen 7000 is only available in the variant with a graphics core, which is new in this generation. The Ryzen 5000 processors (including the 5950X with 16 cores) didn’t have a graphics core. That was exclusive to APUs in earlier generations.
Looking at the specs, the main advantage appears to be a more significant power limit for the all-core boost – PPT of the Ryzen 9 7950X is 230W while the Core i9’s PL2 value is plus 10% (+23W). While this ratio doesn’t necessarily reflect the exact difference in power draw, it is a sure indicator that the Ci9-13900K will have a higher power draw. That is, unless you throttle the power supply down to TDP levels. However, limiting the power draw significantly is naturally possible with the Ryzen 9 7950X as well – the TDP can safely be pulled down to 45 W (with 61 W PPT). Of course, as a result of the significantly lower thermal performance, the electrical and computational performance will drop accordingly.
From the parameters of these processors and from the experience of previous comparisons of the AMD Zen 4 “Raphael” generation with Intel Raptor Lake, it is clear that it will be an extremely evenly matched battle. Again, it depends on which processor is more efficient in the selected workloads and for which applications the architecture of one or the other model is better optimized.
| Manufacturer | AMD | Intel | |
| Line | Ryzen 9 | Core i9 | |
| SKU | 7950X | 13900K | |
| Codename | Raphael | Raptor Lake | |
| CPU microarchitecture | Zen 4 | Golden Cove (P) + Gracemont (E) | |
| Manufacturing node | 5 nm + 6 nm | 7 nm („Intel 7 Ultra“) | |
| Socket | AM5 | LGA 1700 | |
| Launch date | 09/26/2022 | 10/10/ 2022 | |
| Launch price | 699 USD | 589 USD | |
| Core count | 16 | 8+16 | |
| Thread count | 32 | 32 | |
| Base frequency | 4.5 GHz | 3.0 GHz (P)/2.2 GHz (E) | |
| Max. Boost (1 core) | 5.7 GHz (unofficially 5.85 GHz) | 5.8 GHz (P)/4.3 GHz (E) | |
| Max. boost (all-core) | N/A | 5.5 GHz (P)/4.3 GHz (E) | |
| Typ boostu | PB 2.0 | TBM 3.0, TVB, ABT | |
| L1i cache | 32 kB/core | 32 kB/core (P), 64 kB/core (E) | |
| L1d cache | 32 kB/core | 48 kB/core (P), 32 kB/core (E) | |
| L2 cache | 1 MB/core | 2 MB/core (P), 4× 4 MB/4 cores (E) | |
| L3 cache | 2× 32 MB | 1× 36 MB | |
| TDP | 170 W | 125 W | |
| Max. power draw during boost | 230 W (PPT) | 253 W (PL2) | |
| Overclocking support | Yes | Yes | |
| Memory (RAM) support | DDR5-5200 | DDR5-5600/DDR4-3200 | |
| Memory channel count | 2× 64 bit | 2× 64 bit | |
| RAM bandwidth | 83.2 GB/s | 89.6 GB/s/51.2 GB/s | |
| ECC RAM support | Yes (depends on motherboard support) | Yes (with vPro/W680) | |
| PCI Express support | 5.0 | 5.0/4.0 | |
| PCI Express lanes | ×16 + ×4 + ×4 | ×16 (5.0) + ×4 (4.0) | |
| Chipset downlink | PCIe 4.0 ×4 | DMI 4.0 ×8 | |
| Chipset downlink bandwidth | 8.0 GB/s duplex | 16.0 GB/s duplex | |
| BCLK | 100 MHz | 100 MHz | |
| Die size | 2× 66,3 mm² + 118 mm² | ~257 mm² | |
| Transistor count | 2× 6,57 + 3,37 bn. | ? bn. | |
| TIM used under IHS | Solder | Solder | |
| Boxed cooler in package | no | no | |
| Instruction set extensions | SSE4.2, AVX2, FMA, SHA, VAES (256-bit), AVX-512, VNNI | SSE4.2, AVX2, FMA, SHA, VNNI (256-bit), GNA 3.0, VAES (256-bit), vPro | |
| Virtualization | AMD-V, IOMMU, NPT | VT-x, VT-d, EPT | |
| Integrated GPU | AMD Radeon | UHD 770 | |
| GPU architecture | RDNA 2 | Xe LP (Gen. 12) | |
| GPU: shader count | 128 | 256 | |
| GPU: TMU count | 8 | 16 | |
| GPU: ROP count | 4 | 8 | |
| GPU frequency | 400–2200 MHz | 300–1650 MHz | |
| Display outputs | DP 2.0, HDMI 2.1 | DP 1.4a, HDMI 2.1 | |
| Max. resolution | 3840 × 2160 px (60 Hz) | 7680 × 4320 (60 Hz) | |
| HW video encode | HEVC, VP9 | HEVC, VP9 | |
| HW video decode | AV1, HEVC, VP9 | AV1, HEVC, VP9 |
- Contents
- AMD Ryzen 9 7950X in detail
- Methodology: performance tests
- Methodology: how we measure power draw
- Methodology: temperature and clock speed tests
- Test setup
- 3DMark
- Assassin’s Creed: Valhalla
- Borderlands 3
- Counter-Strike: GO
- Cyberpunk 2077
- DOOM Eternal
- F1 2020
- Metro Exodus
- Microsoft Flight Simulator
- Shadow of the Tomb Raider
- Total War Saga: Troy
- Overall gaming performance
- Gaming performance per euro
- PCMark and Geekbench
- Web performance
- 3D rendering: Cinebench, Blender, ...
- Video 1/2: Adobe Premiere Pro
- Video 2/2: DaVinci Resolve Studio
- Graphics effects: Adobe After Effects
- Video encoding
- Audio encoding
- Broadcasting (OBS and Xsplit)
- Photos 1/2: Adobe Photoshop and Lightroom
- Photos 2/2: Affinity Photo, Topaz Labs AI Apps, ZPS X, ...
- (De)compression
- (De)encryption
- Numerical computing
- Simulations
- Memory and cache tests
- Processor power draw curve
- Average processor power draw
- Performance per watt
- Achieved CPU clock speed
- CPU temperature
- Conclusion


