Conclusion
The cheaper of the pair of Radeons with the Navi 32 GPU is priced closest to the GeForce RTX 4060 Ti. Although the RX 7700XT is a bit pricier, it often has a significant performance edge, even attacking the RTX 4070. In this comparison, the RX 7700 XT with ray-tracing is already noticeably behind, and its efficiency is a notch weaker, but the price-performance ratio is often still better. And this is also true for the Sapphire Pure version in white.
Conclusion
At the recommended 1440p resolution, the RX 7700 XT’s average gaming performance is up 18% ahead of the RTX 4060 Ti. That is, unless we take ray-tracing into account. With it, Radeon’s lead shrinks, and in selected games the situation even flips and the RTX 4060 Ti suddenly has the upper hand. However, this behaviour is usually rare, for example in Battlefield V. Even in Control, where price-equivalent Radeons usually lag behind GeForce cards (including the RX 7800 XT and the RTX 4070), the RX 7700 XT doesn’t represent a weaker option compared to the RTX 4060 Ti. Not even in Cypberpunk 2077 with extensive RT effects. However, the application of FSR is already necessary for smooth operation here (CP77). Shadow of the Tomb Raider and the original Metro Exodus are both playable (at 1440p) at native resolution with ray tracing and overall highest detail.
Sometimes the RX 7700 XT even beats the RTX 4070 – for example in Borderlands 3 (1440p). You won’t find many titles where (compared to the RX 7700 XT) the RTX 4060 Ti is in the lead. Sure, except for titles with exclusive DLSS 3 support, but that’s not happening at the same image quality anymore. And although the RX 7700 XT is primarily aimed at QHD (1440p), it’s a usable graphics card for UHD (2160p) as well. Somewhere triple-digit fps is achieved without the need to reduce visual detail. This is the case in, for example, v CS:GO, v DOOM Eternal, v F1 (2020), vo FIFA (21) or vo Forza Horizon 4. Even Assassin’s Creed: Valhalla, Battlefield V (without RT) or Wasteland 3 don’t drop below 60 fps.
In terms of computing performance, compared to the RTX 4060 Ti, it’s like a seesaw. In applications with CUDA support, the RX 7700 XT (under OCL) is usually the slower choice, but under OpenCL or OpenGL, the Radeon often has the upper hand. Whether it’s raw performance for 3D rendering (we have test results with the Eevee renderer), for engineering applications or accelerating filters in Adobe Photoshop.

The big disadvantage of the RX 7700 XT compared to the RTX 4060 Ti/4070 is in its significantly higher power draw under load, hence the significantly lower efficiency. This has only increased by 14–16% compared to the last generation (RX 6700 XT). Compared to the only slightly faster GeForce RTX 3080 the efficiency ratio of the RX 7700 XT is significantly more favorable
, but it’s not enough for Nvidia’s (Ada Lovelace) state-of-the-art graphics cards
. Both gaming and computing performance per watt is significantly worse on the RX 7700, roughly 30% below the RTX 4070.
Relatively higher (but not high) compared to the RTX 4060 Ti (and RTX 4070) is the power draw under lighter workloads, such as video playback (HEVC, VP9) or working in a web browser with GPU acceleration enabled. However, the average power draw in idle (inactive Windows OS desktop) or for light office use (text, spreadsheets, etc.) is already lower on the RX 7700 XT. And that’s the case even in a multi-monitor or single high-speed monitor configuration. The difference in power draw here is negligible
(9,4 vs. 11,0 W).
The RX 7700 XT in the Sapphire Pure design is a little noisier compared to the RX 7800 XT Nitro+ (it’s still not a noisy card, though)
, which is partly due to the lower efficiency of the smaller cooler, but also to the more aggressive speed control. In fact, cooling tests indicate that the RX 7700 XT’s temperatures are lower and by a fairly large margin, so there’s some room for fine-tuning here. You won’t miss the coil sound, but their acoustic profile could be classified as average, with none of the more aggressive tonal peaks.
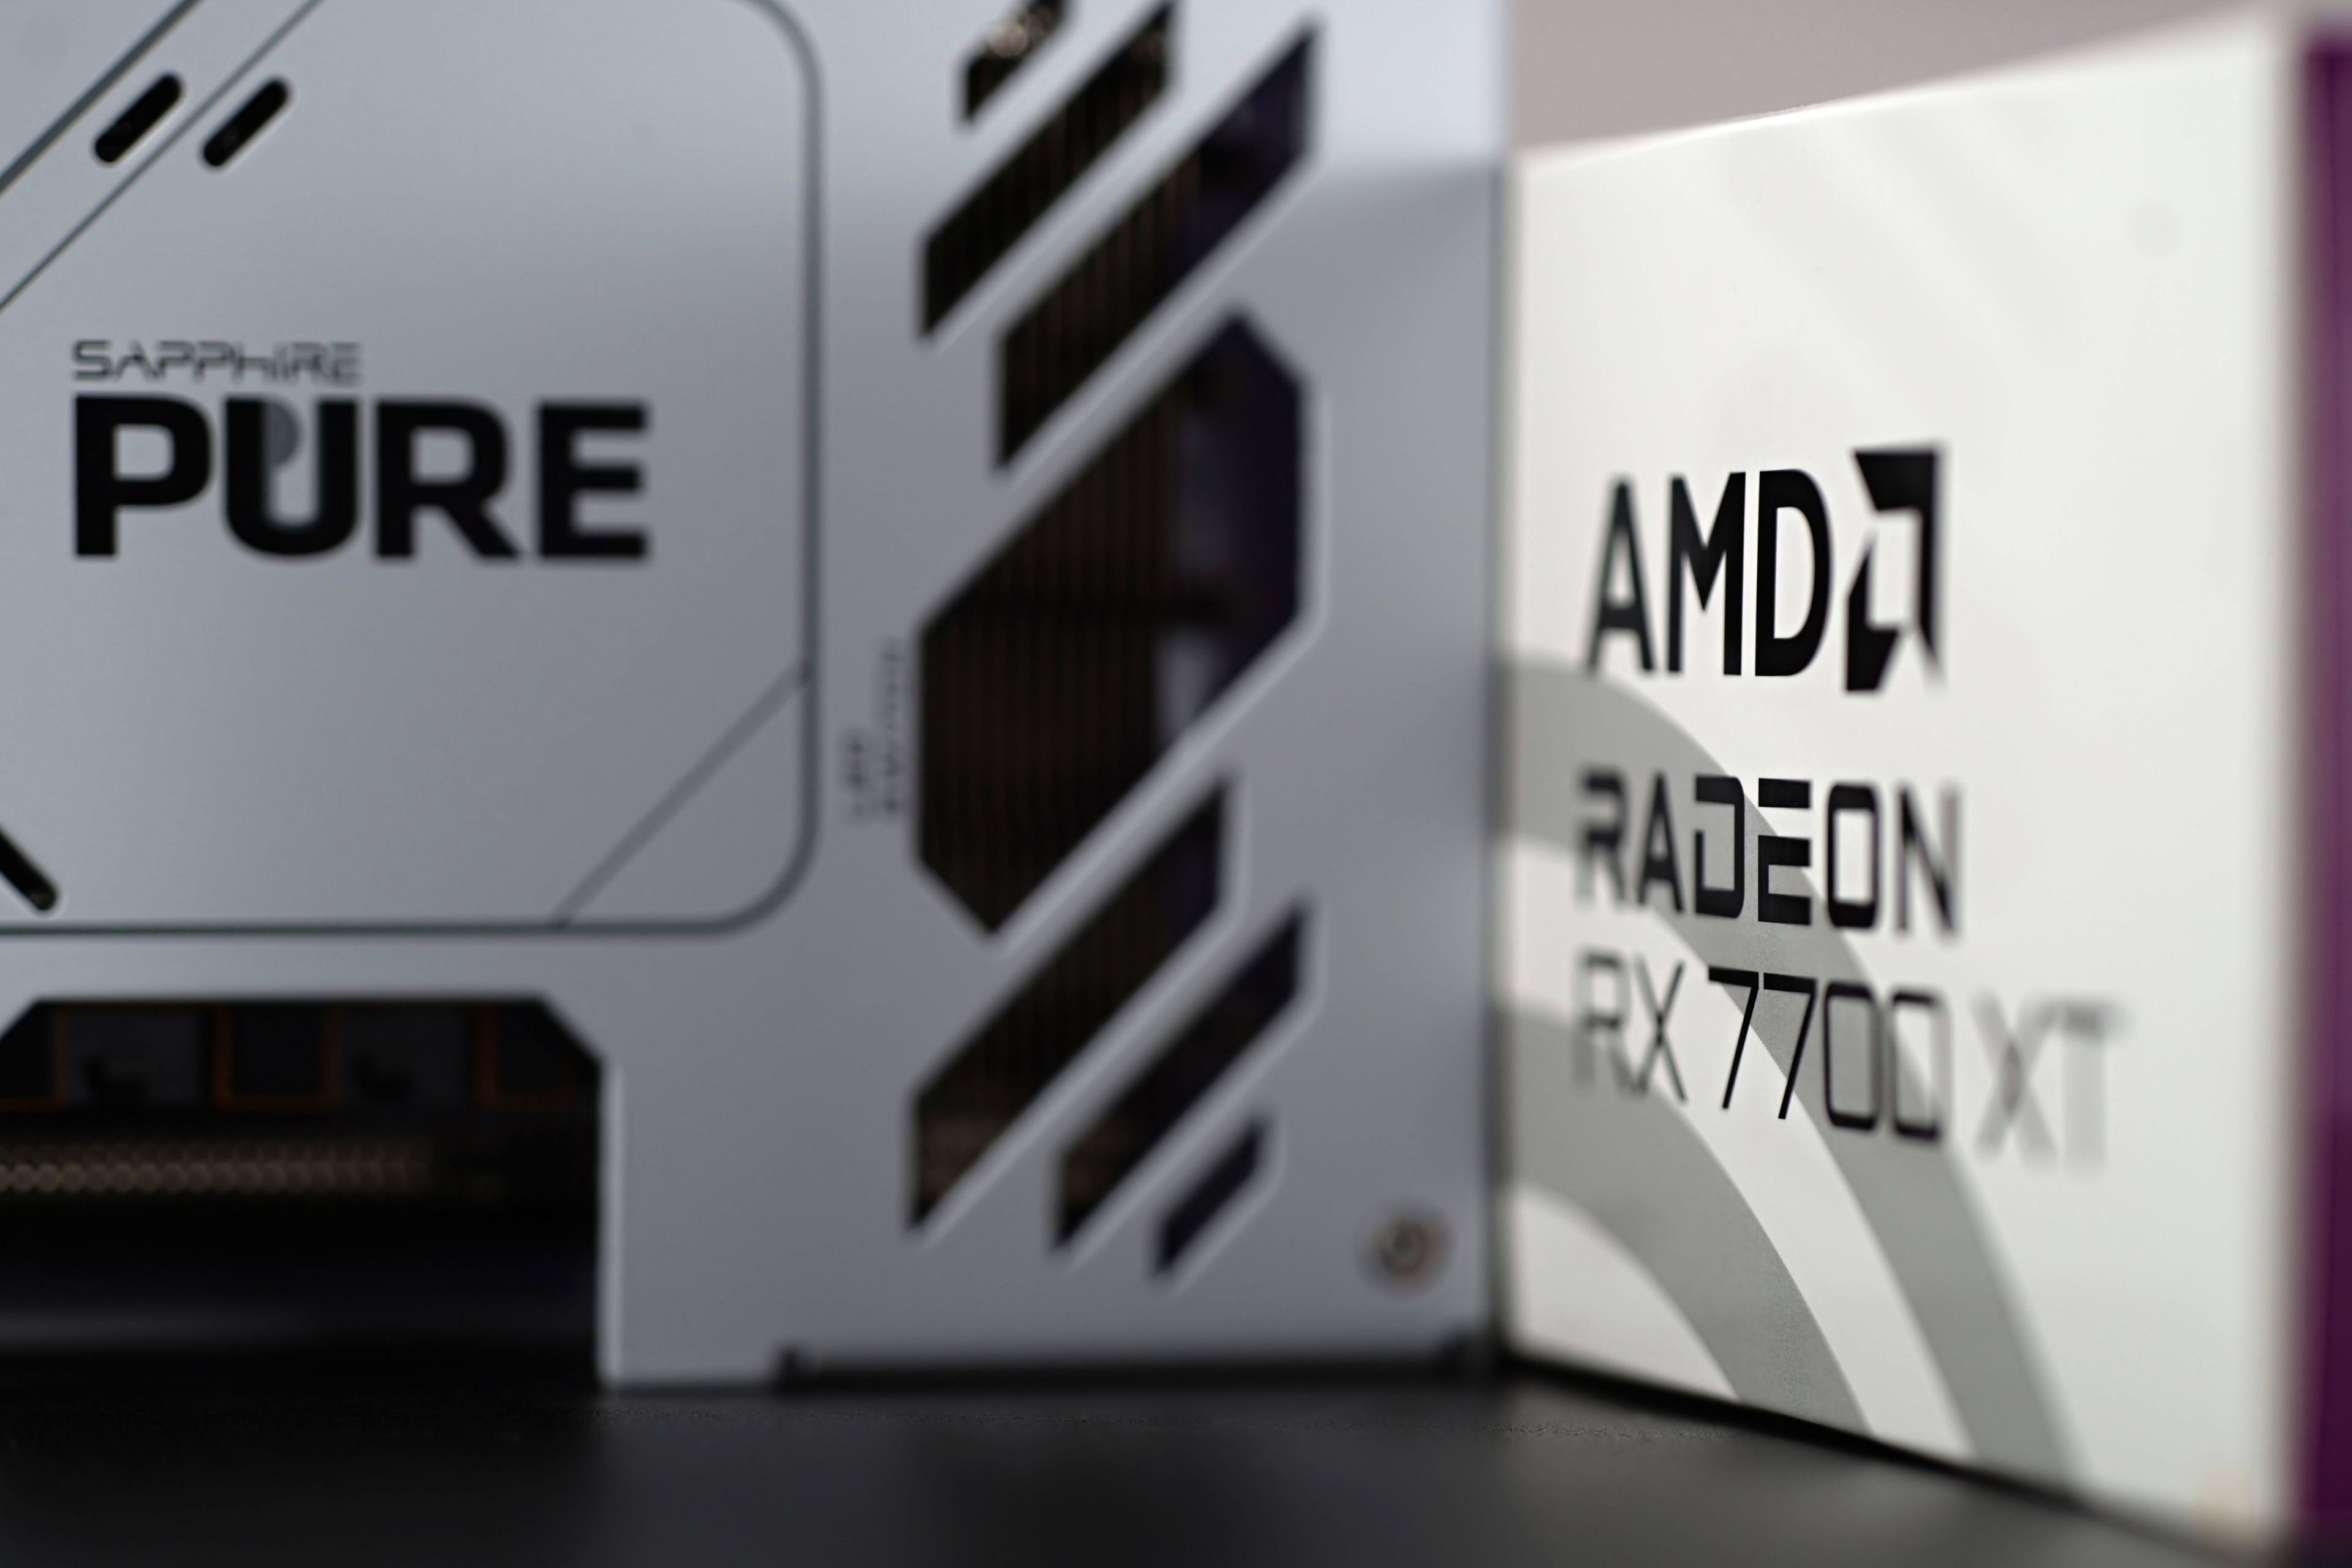
GPU clock speeds in games range between 2505–2647 MHz depending on the workload, which exceeds Sapphire’s specifications. And this can be viewed positively. Overall, the Sapphire RX 7700 XT is a very solid graphics card that combines an attractive design with an attractive price/performance ratio, for which it deserves the “Smart buy!” award.
English translation and edit by Jozef Dudáš
| Sapphire RX 7700 XT Pure |
| + High performance (especially suitable for 1440p/QHD gaming) |
| + Favorable price/performance ratio |
| + Without ray-tracing quite a bit faster than the RTX 4060 Ti, catching up to the RTX 4070 |
| + Efficient cooler. Not noisy even at higher power draw... |
| + ... and yet the temperature is reasonably low |
| + AV1 encoding support |
| + DisplayPort version 2.1, which is not supported by GeForce |
| + Low power draw in idle |
| + Rare, all-white design |
| - Weaker performance with ray-tracing graphics. Does not even reach the level of the Nvidia Ampere generation (RTX 3000) |
| - Significantly worse power efficiency than the competing RTX 4060 Ti/RTX 4070 |
| Suggested retail price: 499 EUR |
We would like to thank the Datacomp e-shop for their cooperation in providing the tested hardware
![]()
- Contents
- Sapphire RX 7700 XT Pure in detail
- Table of parameters
- Methodology: performance tests
- Methodology: how we measure power draw
- Methodology: noise and sound measurement
- Methodology: temperature tests
- Test setup
- 3DMark
- Age of Empires II: DE
- Assassin’s Creed: Valhalla
- Battlefield V
- Battlefield V with DXR
- Borderlands 3
- Control
- Control with DXR
- Counter-Strike: GO
- Cyberpunk 2077
- Cyberpunk 2077 with DXR
- DOOM Eternal
- F1 2020
- FIFA 21
- Forza Horizon 4
- Mafia: DE
- Metro Exodus
- Metro Exodus with DXR
- Microsoft Flight Simulator
- Red Dead Redemption 2 (Vulkan)
- Red Dead Redemption 2 (Dx12)
- Shadow of the Tomb Raider
- Shadow of the Tomb Raider with DXR
- Total War Saga: Troy
- Wasteland 3
- Overall gaming performance and performance per euro
- CompuBench (OpenCL)
- SPECviewperf 2020 and SPECworkstation 3
- FLOPS, IOPS and memory speed tests
- 3D rendering 1/2 (LuxMark and Blender@Cycles)
- 3D rendering 2/2 (Blender@Radeon ProRender and Eevee)
- Photo editing (Adobe Photoshop, Lightroom and Affinity Photo)
- Broadcasting (OBS and Xsplit)
- Password cracking
- GPU clock speed
- GPU and VRAM temperatures
- Net graphics card power draw and performance per watt
- Analysis of 12 V branch power supply (higher load)
- Analysis of 12 V branch power supply (lower load)
- Analysis of 3.3 V branch power supply
- Noise level
- Frequency response of sound
- Conclusion