Testing methodology
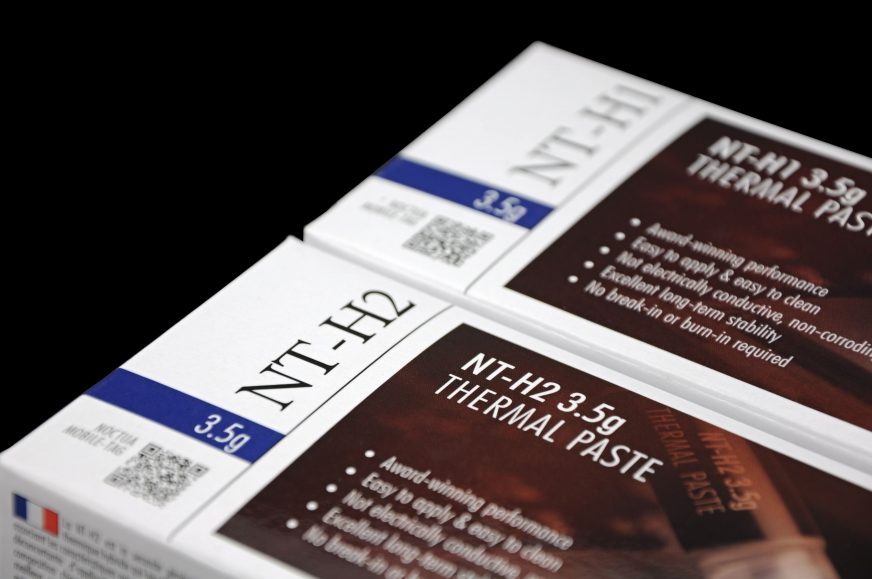
The initial skepticism about the NT-H2 subsided very quickly. We have exposed this thermal paste to various tests and it gives excellent results across the whole spectrum of them. The original NT-H1, which Noctua will continue to offer as a cheaper option, served well as a reference point for comparison. The new NT-H2 already belongs to the high-end as it should. See for yourselves in a detailed review.
Testing methodology
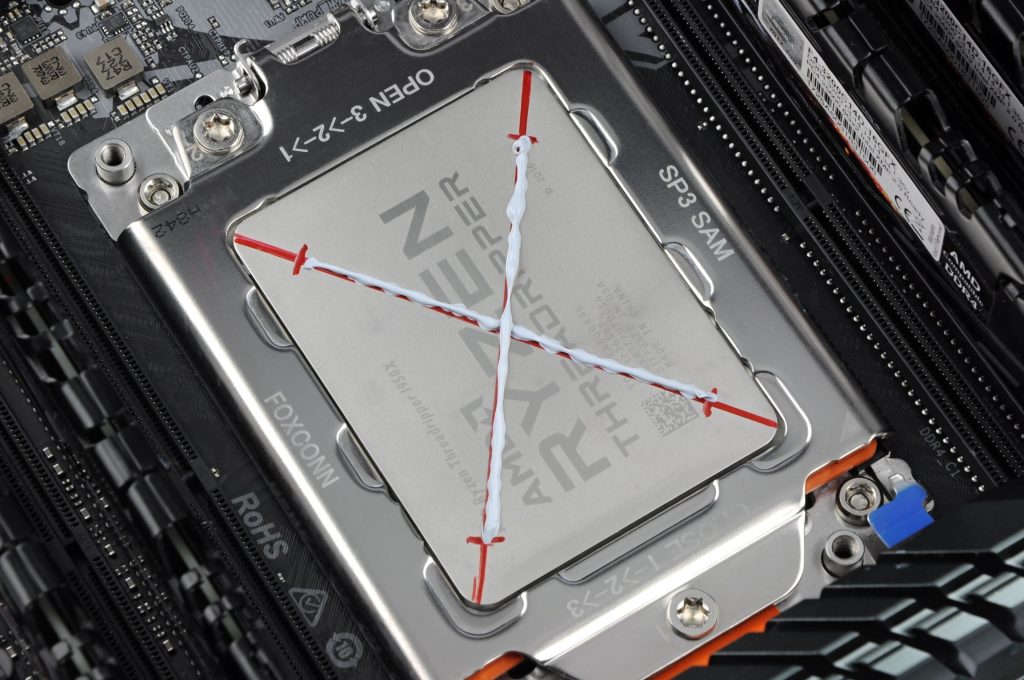
The heating element is Threadripper 1950X. We’ve chosen it for several reasons. On the one hand, it allows simulation of a wide range of thermal loads (we will get to specific modes later), on the other hand, it has more efficient heat transfer from the die to the IHS and, last but not least, it has a large heat spreader area which also contributes to significant differences between a better and a worse paste.
As for the application itself, Noctua suggests a multi-dot pattern for AMD TR4 or Intel LGA 3647 sockets. One larger dot above each die (i.e. four with a diameter of 3 – 4 mm) and then nine smaller ones (~ 2 mm) spread somewhat evenly into the rest of the area. With all due respect to Noctua, we used a more conventional and, above all, more economical application of the thermal paste in the X shape in real tests. Of course, we also tried the recommended Noctua method exactly according to the instruction. This way, you will really cover 100% of the IHS area, but this is not necessary. With the X shape method (and about half the amount), while a total of about 5% of the blank space remains on the sides, this has only a minimal effect on the result. But that is another topic… The aim of this test was to secure identical conditions for both pastes which is one of the reasons why we have guiding lines indicated on the IHS and a precisely regulated amount of paste using a measuring cup. And the accuracy test was performed by repeating the assembly, when we checked the conformity of the measured results.
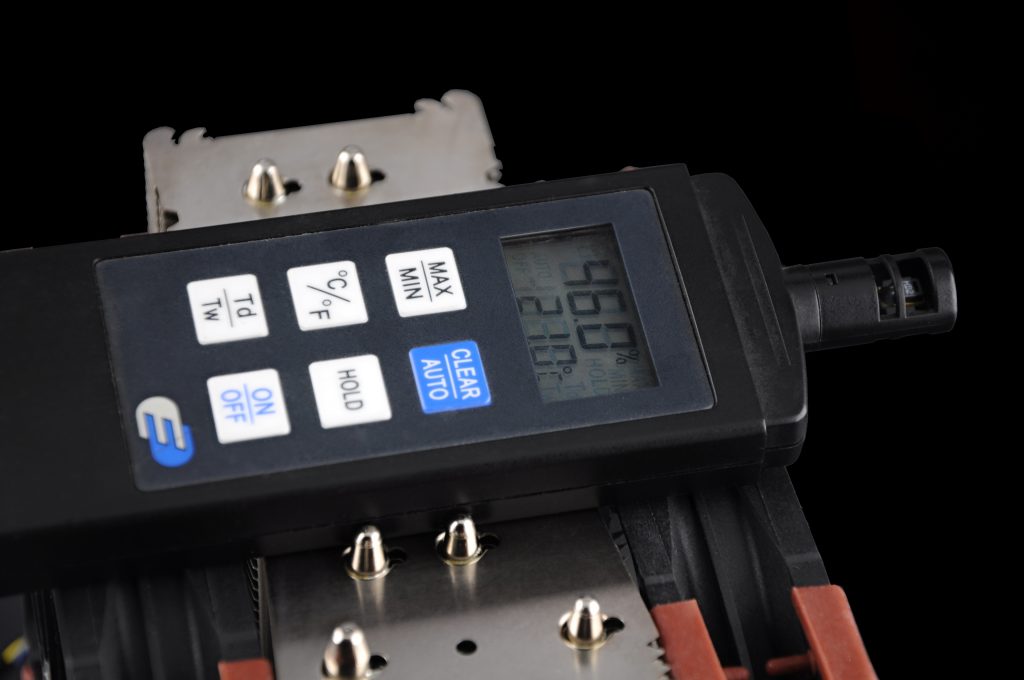
The results and differences can also be easily disturbed by fluctuations in the entry air temperature (typically by heat accumulation) in front of the fan. For this reason, the entry temperature is constantly monitored and is in the close range of 21 – 21.1 °C so that no unwanted rounding of the measured values occurs even by accident across the tests. By the way, we read these from the internal sensor via HWinfo, at the end of a 900-second “torture” marathon in Prime95 with a constant FFT of 128 K.
Cooling takes place on a bench table, i.e. without system cooling, and the processor cooler used is Noctua NH-U14S TR4-SP3 with two high-speed fans NF-F12 industrialPPC-2000@24 V (i.e. 2× 2000 rpm).
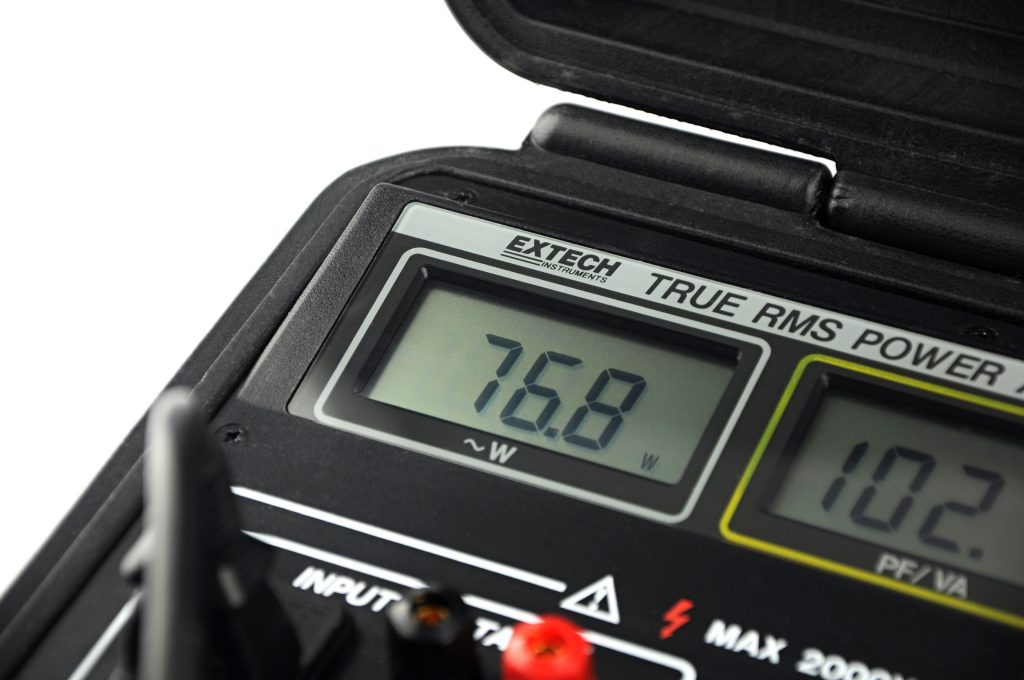
We created five profiles for testing purposes with a total power consumption of the test set of 240, 290, 340, 390 and 440 W. Of these values, other active components unrelated to the processor make about 50 W and the power supply efficiency must be taken into account, so the graphs show the wattages of 175, 225, 275, 325 and 375 W. But even this is not the most accurate, because VRM losses are still included. This is one of the reasons why the “CPU Power Package” usually reports an even 10% lower “net” consumption. For a rough orientation, however, this is enough, gradation and a wide range of performance loads in the range of 200 W are important.
Note: after assembly, before a real test, we’re burning-in for half an hour in the 375 W mode. This, of course, is not enough for the paste to “break in”. However, Noctua claims that thermally conductive properties do not change in any way with the time of use. Full-featured results are achieved from the beginning of use. In our case then, we are only talking about some kind of basic warm-up and putting the paste into working form.
| Testovacia konfigurácia | |
| Processor | AMD Threadripper 1950X |
| RAM | G.Skill Flare X, 4× 8 GB, 3200 MHz/CL14 |
| Motherboard | ASRock X399 Taichi (BIOS P3.50) |
| Graphics card | Sapphire Nitro+ RX Vega 64 |
| SSD | Patriot Hellfire (480 GB) |
| PSU | SeaSonic Prime 650 W (80Plus Titanium) |


